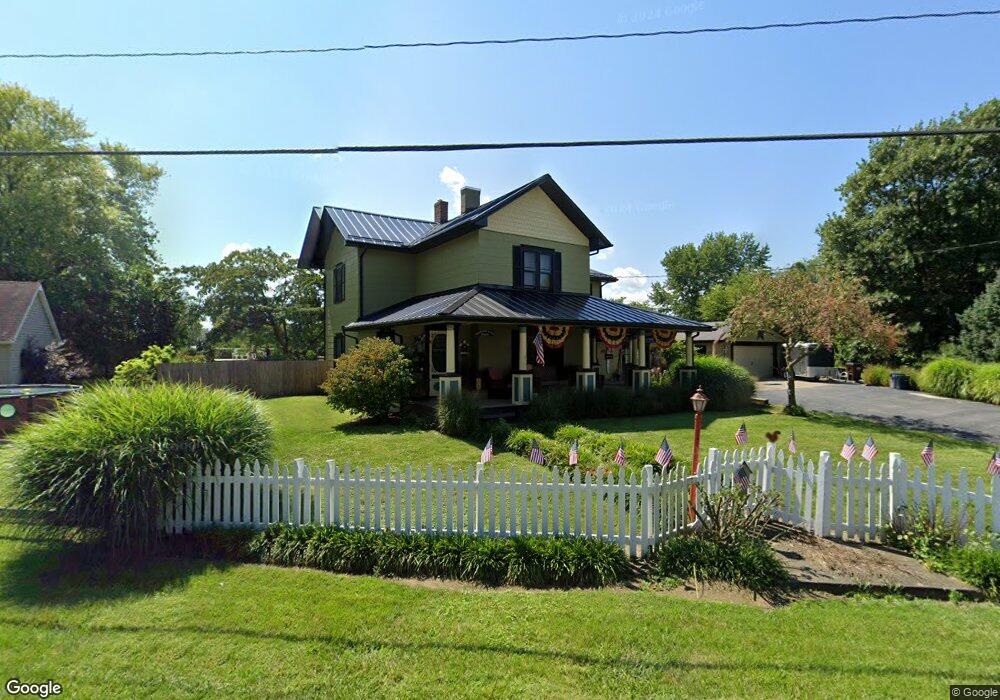
47 Main St Orient, OH 43146
Estimated Value: $102,000 - $331,000
About This Home
This home is located at 47 Main St, Orient, OH 43146 and is currently estimated at $268,845, approximately $158 per square foot. 47 Main St is a home located in Pickaway County.
Ownership History
We collect this data history from publicly available records. To have your information removed, we recommend requesting removal directly through your county’s website.
Purchase Details
Home Financials for this Owner
Home Financials are based on the most recent Mortgage that was taken out on this home.Purchase Details
Home Values in the Area
Average Home Value in this Area
Purchase History
We collect this data history from publicly available records. To have your information removed, we recommend requesting removal directly through your county’s website.
| Date | Buyer | Sale Price | Title Company |
|---|---|---|---|
| $109,900 | -- | ||
| $16,000 | -- |
Mortgage History
We collect this data history from publicly available records. To have your information removed, we recommend requesting removal directly through your county’s website.
| Date | Status | Borrower | Loan Amount |
|---|---|---|---|
| Open | $98,900 |
Tax History
We collect this data history from publicly available records. To have your information removed, we recommend requesting removal directly through your county’s website.
| Year | Tax Paid | Tax Assessment Tax Assessment Total Assessment is a certain percentage of the fair market value that is determined by local assessors to be the total taxable value of land and additions on the property. | Land | Improvement |
|---|---|---|---|---|
| 2025 | $4,036 | $78,200 | $14,770 | $63,430 |
| 2024 | $4,036 | $78,200 | $14,770 | $63,430 |
| 2023 | $2,944 | $78,200 | $14,770 | $63,430 |
| 2022 | $2,548 | $62,170 | $12,140 | $50,030 |
| 2021 | $2,556 | $62,170 | $12,140 | $50,030 |
| 2020 | $2,556 | $62,170 | $12,140 | $50,030 |
| 2019 | $2,035 | $51,130 | $11,480 | $39,650 |
| 2018 | $1,995 | $51,130 | $11,480 | $39,650 |
| 2017 | $2,047 | $51,130 | $11,480 | $39,650 |
| 2016 | $1,904 | $47,440 | $10,830 | $36,610 |
| 2015 | $1,905 | $47,440 | $10,830 | $36,610 |
| 2014 | $1,907 | $47,440 | $10,830 | $36,610 |
| 2013 | $1,986 | $47,490 | $10,830 | $36,660 |
Map
- 290 Olympic Loop
- 304 Mahogany Ln
- 289 Arledge Dr
- 24 Erin Hills Rd
- 291 Flint Ct
- 62 Chambers Bay Rd
- 440 Oakland Hills Loop
- 283 Mahogany Ln
- 56 Chambers Bay Rd
- 288 Mahogany Ln
- 52 Genoa Cir
- 66 Genoa Cir
- 317 Genoa Rd
- 420 Lockbay Rd
- 30 Waterman Ave
- 485 Creekside Dr Unit WK84
- 485 Creekside Dr
- 502 Heidish Dr
- 502 Conley Dr
- 111 Grove Run Rd
Ask me questions while you tour the home.