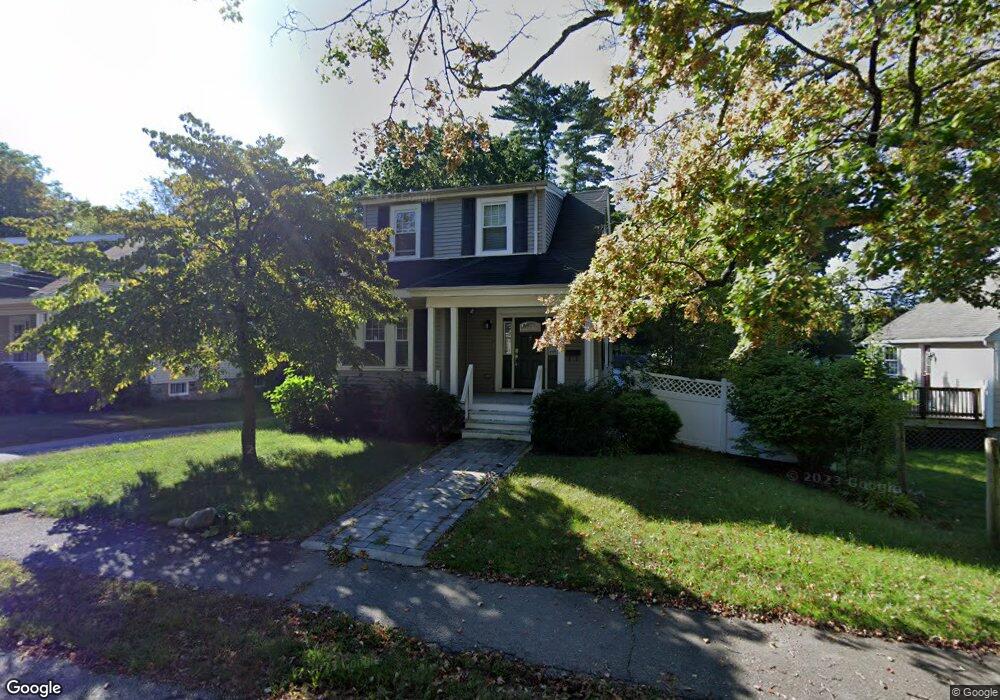
47 Maplewood Ave Holbrook, MA 02343
Estimated Value: $537,000 - $583,000
2
Beds
1
Bath
1,234
Sq Ft
$450/Sq Ft
Est. Value
About This Home
This home is located at 47 Maplewood Ave, Holbrook, MA 02343 and is currently estimated at $555,835, approximately $450 per square foot. 47 Maplewood Ave is a home located in Norfolk County with nearby schools including John F. Kennedy Elementary School, Holbrook Middle High School, and Boston Higashi School.
Ownership History
Date
Name
Owned For
Owner Type
Purchase Details
Closed on
Aug 23, 2016
Sold by
Buckley Thomas B and Citimortgage Inc
Bought by
Citimortgage Inc
Current Estimated Value
Purchase Details
Closed on
Jun 25, 2010
Sold by
Johnson Shawn D and Johnson Keri M
Bought by
Buckley Thomas B
Home Financials for this Owner
Home Financials are based on the most recent Mortgage that was taken out on this home.
Original Mortgage
$246,678
Interest Rate
4.98%
Mortgage Type
Purchase Money Mortgage
Purchase Details
Closed on
Dec 10, 2002
Sold by
Fry Sean M and Fry Kristin A
Bought by
Johnson Shawn D and Johnson Keri M
Purchase Details
Closed on
Feb 28, 2001
Sold by
Disher John W and Disher Maryellen
Bought by
Fry Sean M and Fry Kristin A
Purchase Details
Closed on
Jun 29, 1999
Sold by
Andrews James E and Andrews Jane E
Bought by
Disher John W and Disher Maryellen
Create a Home Valuation Report for This Property
The Home Valuation Report is an in-depth analysis detailing your home's value as well as a comparison with similar homes in the area
Home Values in the Area
Average Home Value in this Area
Purchase History
| Date | Buyer | Sale Price | Title Company |
|---|---|---|---|
| Citimortgage Inc | $292,800 | -- | |
| Citimortgage Inc | $292,800 | -- | |
| Citimortgage Inc | $292,800 | -- | |
| Buckley Thomas B | $250,000 | -- | |
| Buckley Thomas B | $250,000 | -- | |
| Buckley Thomas B | $250,000 | -- | |
| Johnson Shawn D | $250,000 | -- | |
| Johnson Shawn D | $250,000 | -- | |
| Fry Sean M | $190,000 | -- | |
| Disher John W | $157,000 | -- |
Source: Public Records
Mortgage History
| Date | Status | Borrower | Loan Amount |
|---|---|---|---|
| Previous Owner | Buckley Thomas B | $246,678 |
Source: Public Records
Tax History
| Year | Tax Paid | Tax Assessment Tax Assessment Total Assessment is a certain percentage of the fair market value that is determined by local assessors to be the total taxable value of land and additions on the property. | Land | Improvement |
|---|---|---|---|---|
| 2025 | $65 | $491,300 | $209,800 | $281,500 |
| 2024 | $6,079 | $452,300 | $190,700 | $261,600 |
| 2023 | $6,475 | $421,000 | $173,400 | $247,600 |
| 2022 | $6,113 | $370,700 | $150,700 | $220,000 |
| 2021 | $5,822 | $338,100 | $140,900 | $197,200 |
| 2020 | $5,954 | $324,100 | $134,100 | $190,000 |
| 2019 | $5,918 | $304,100 | $119,500 | $184,600 |
| 2018 | $5,323 | $257,500 | $101,300 | $156,200 |
| 2017 | $5,223 | $249,900 | $101,300 | $148,600 |
| 2016 | $4,912 | $250,100 | $112,900 | $137,200 |
| 2015 | $4,547 | $238,300 | $106,100 | $132,200 |
| 2014 | $4,293 | $228,700 | $96,500 | $132,200 |
Source: Public Records
Map
Nearby Homes
- 120 Roberts Ave
- 5 Clarendon Cir Unit Lot 4
- 20 Isabelle Ave
- 27 Winter St
- 327 Union St
- 249 Mill St
- 229 Mill St
- 278 N Franklin St
- 217 Mill St
- 58 Chandler St
- 9 Fernandez Cir
- 123-125 N Franklin St
- 1 Young Terrace
- 5 Patterson Ave E
- 276 Center St
- 8 Dianthus Rd
- 12 Tucker Terrace
- 158 Union St
- 152 S Franklin St
- 14 Washington Cir
- 4 Birchwood Rd
- 45 Maplewood Ave
- 1 Birchwood Rd
- 8 Birchwood Rd
- 50 Maplewood Ave
- 39 Maplewood Ave
- 12 Birchwood Rd
- 7 Birchwood Rd
- 69 Maplewood Ave
- 71 Maplewood Ave
- 36 Mount Pleasant Ave
- 16 Birchwood Rd
- 9 Birchwood Rd
- 26 Maplewood Ave
- 40 Mount Pleasant Ave
- 68 Maplewood Ave
- 20 Mount Pleasant Ave
- 32 Mount Pleasant Ave
- 21 Maplewood Ave
- 15 Birchwood Rd
Your Personal Tour Guide
Ask me questions while you tour the home.