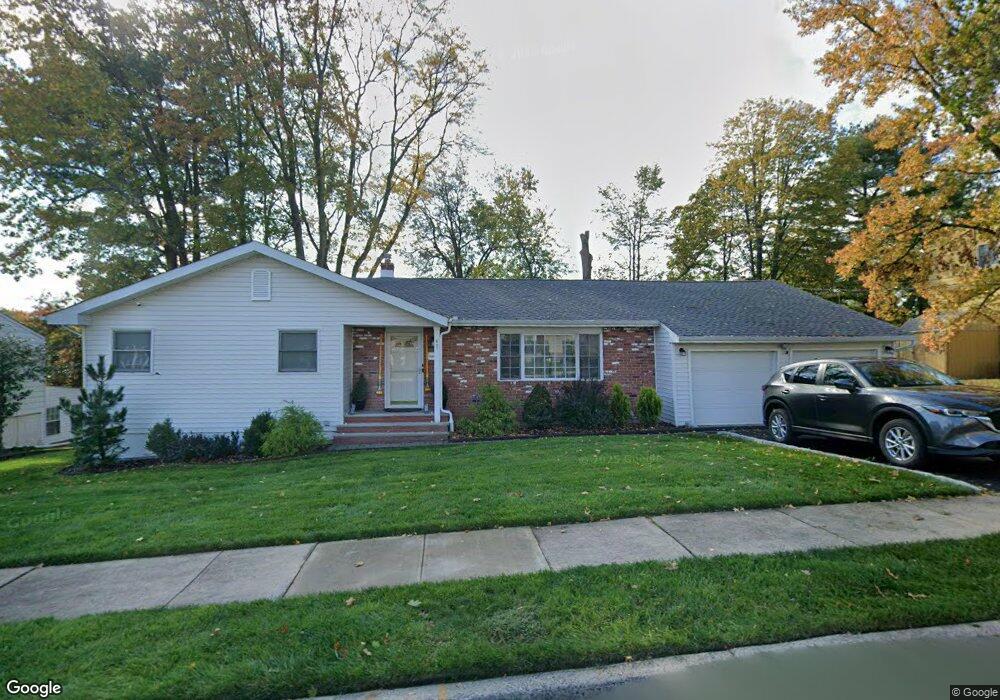
47 Marlin Ave W Unit na Edison, NJ 08820
Estimated Value: $767,624 - $864,000
3
Beds
2
Baths
1,508
Sq Ft
$545/Sq Ft
Est. Value
About This Home
This home is located at 47 Marlin Ave W Unit na, Edison, NJ 08820 and is currently estimated at $821,406, approximately $544 per square foot. 47 Marlin Ave W Unit na is a home located in Middlesex County with nearby schools including Menlo Park Elementary School, Woodrow Wilson Middle School, and J.P. Stevens High School.
Ownership History
Date
Name
Owned For
Owner Type
Purchase Details
Closed on
Mar 10, 2021
Sold by
Db1 Enterprises
Bought by
Gupta Rahul Santosh and Gupta She
Current Estimated Value
Home Financials for this Owner
Home Financials are based on the most recent Mortgage that was taken out on this home.
Original Mortgage
$455,000
Outstanding Balance
$408,082
Interest Rate
2.73%
Mortgage Type
New Conventional
Estimated Equity
$413,324
Purchase Details
Closed on
Jul 1, 2020
Sold by
Coelho Urban J and Estate Of Debra Coelho
Bought by
Db1 Enterprises Inc
Home Financials for this Owner
Home Financials are based on the most recent Mortgage that was taken out on this home.
Original Mortgage
$374,500
Interest Rate
3.2%
Mortgage Type
Construction
Purchase Details
Closed on
Jul 25, 2005
Create a Home Valuation Report for This Property
The Home Valuation Report is an in-depth analysis detailing your home's value as well as a comparison with similar homes in the area
Home Values in the Area
Average Home Value in this Area
Purchase History
| Date | Buyer | Sale Price | Title Company |
|---|---|---|---|
| Gupta Rahul Santosh | $525,000 | Fidelity National Ttl Ins Co | |
| Gupta Rahul Santosh | $525,000 | Land Title | |
| Db1 Enterprises Inc | $365,000 | Fit Agency Llc | |
| -- | -- | -- |
Source: Public Records
Mortgage History
| Date | Status | Borrower | Loan Amount |
|---|---|---|---|
| Open | Gupta Rahul Santosh | $455,000 | |
| Closed | Gupta Rahul Santosh | $455,000 | |
| Previous Owner | Db1 Enterprises Inc | $374,500 |
Source: Public Records
Tax History Compared to Growth
Tax History
| Year | Tax Paid | Tax Assessment Tax Assessment Total Assessment is a certain percentage of the fair market value that is determined by local assessors to be the total taxable value of land and additions on the property. | Land | Improvement |
|---|---|---|---|---|
| 2025 | $13,555 | $227,700 | $120,000 | $107,700 |
| 2024 | $13,482 | $227,700 | $120,000 | $107,700 |
| 2023 | $13,482 | $227,700 | $120,000 | $107,700 |
| 2022 | $13,048 | $220,300 | $120,000 | $100,300 |
| 2021 | $12,401 | $220,300 | $120,000 | $100,300 |
| 2020 | $12,885 | $220,300 | $120,000 | $100,300 |
| 2019 | $11,914 | $220,300 | $120,000 | $100,300 |
| 2018 | $12,099 | $220,300 | $120,000 | $100,300 |
| 2017 | $11,843 | $220,300 | $120,000 | $100,300 |
| 2016 | $11,138 | $220,300 | $120,000 | $100,300 |
| 2015 | $10,715 | $220,300 | $120,000 | $100,300 |
| 2014 | $10,411 | $220,300 | $120,000 | $100,300 |
Source: Public Records
Map
Nearby Homes
- 47 Marlin Ave W
- 41 Marlin Ave W
- 49 Marlin Ave W
- 48 Frost Ave W
- 42 Frost Ave W
- 42 Frost Ave W Unit 2800
- 46 Marlin Ave W
- 48 Marlin Ave W
- 42 Marlin Ave W
- 37 Marlin Ave W
- 38 Frost Ave W
- 47 Walker Ave
- 38 Marlin Ave W
- 49 Walker Ave
- 41 Frost Ave W
- 4 Concord St
- 41 Walker Ave
- 50 Frost Ave W
- 33 Marlin Ave W
- 37 Frost Ave W