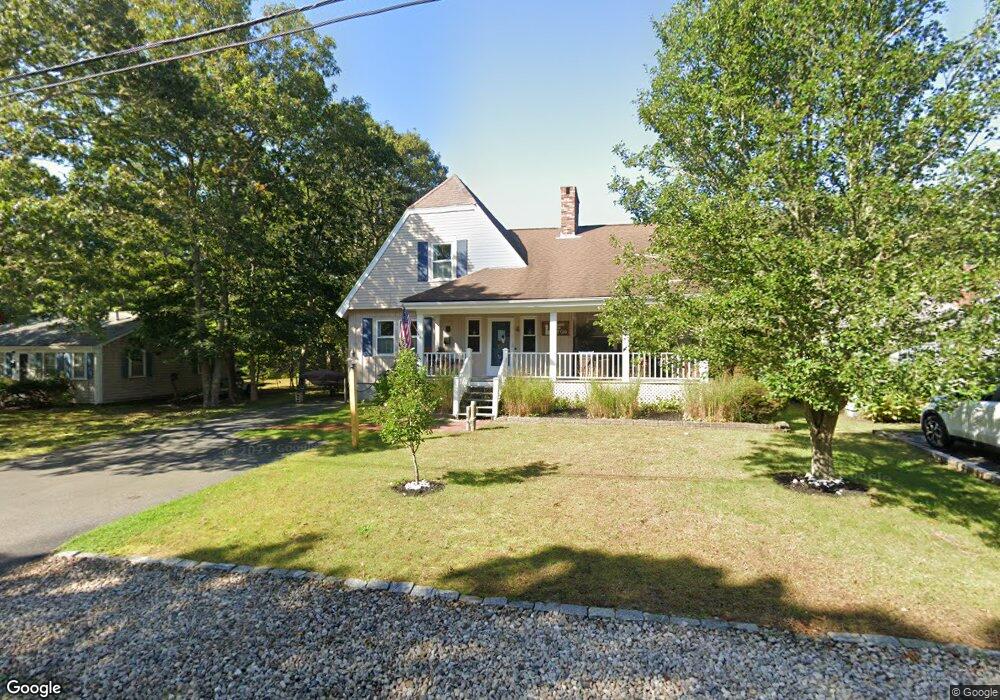
47 Mattachee Rd South Yarmouth, MA 02664
Estimated Value: $829,329 - $956,000
4
Beds
2
Baths
1,801
Sq Ft
$482/Sq Ft
Est. Value
About This Home
This home is located at 47 Mattachee Rd, South Yarmouth, MA 02664 and is currently estimated at $868,832, approximately $482 per square foot. 47 Mattachee Rd is a home located in Barnstable County with nearby schools including Dennis-Yarmouth Regional High School, Sturgis Charter Public School, and St. Pius X. School.
Ownership History
Date
Name
Owned For
Owner Type
Purchase Details
Closed on
Sep 24, 2024
Sold by
Sanclemente Frank and Sanclemente Mark F
Bought by
Frank Sanclemente Irt and Sanclemente
Current Estimated Value
Purchase Details
Closed on
Jun 6, 2019
Sold by
Sanclemente Frank
Bought by
Sanclemente Frank and Sanclemente Mark F
Purchase Details
Closed on
Sep 25, 2003
Sold by
Nickinello Louis
Bought by
Sanclemente Frank and Sanclemente Dolores J
Purchase Details
Closed on
Jul 31, 2001
Sold by
Nickinello Louis R and Nickinello Patricia R
Bought by
Nickinello Louis
Home Financials for this Owner
Home Financials are based on the most recent Mortgage that was taken out on this home.
Original Mortgage
$100,000
Interest Rate
7.18%
Mortgage Type
Purchase Money Mortgage
Create a Home Valuation Report for This Property
The Home Valuation Report is an in-depth analysis detailing your home's value as well as a comparison with similar homes in the area
Home Values in the Area
Average Home Value in this Area
Purchase History
| Date | Buyer | Sale Price | Title Company |
|---|---|---|---|
| Frank Sanclemente Irt | -- | None Available | |
| Frank Sanclemente Irt | -- | None Available | |
| Sanclemente Frank | -- | -- | |
| Sanclemente Frank | -- | -- | |
| Sanclemente Frank | $372,250 | -- | |
| Nickinello Louis | $135,000 | -- | |
| Sanclemente Frank | $372,250 | -- | |
| Nickinello Louis | $135,000 | -- |
Source: Public Records
Mortgage History
| Date | Status | Borrower | Loan Amount |
|---|---|---|---|
| Previous Owner | Nickinello Louis | $116,000 | |
| Previous Owner | Nickinello Louis | $100,000 | |
| Previous Owner | Nickinello Louis | $98,000 |
Source: Public Records
Tax History Compared to Growth
Tax History
| Year | Tax Paid | Tax Assessment Tax Assessment Total Assessment is a certain percentage of the fair market value that is determined by local assessors to be the total taxable value of land and additions on the property. | Land | Improvement |
|---|---|---|---|---|
| 2025 | $5,464 | $771,800 | $215,400 | $556,400 |
| 2024 | $5,069 | $686,800 | $187,300 | $499,500 |
| 2023 | $4,983 | $614,400 | $158,100 | $456,300 |
| 2022 | $4,468 | $486,700 | $141,500 | $345,200 |
| 2021 | $4,378 | $457,900 | $141,500 | $316,400 |
| 2020 | $4,179 | $417,900 | $139,300 | $278,600 |
| 2019 | $3,884 | $384,600 | $139,300 | $245,300 |
| 2018 | $3,873 | $376,400 | $131,100 | $245,300 |
| 2017 | $3,772 | $376,400 | $131,100 | $245,300 |
| 2016 | $3,756 | $376,400 | $131,100 | $245,300 |
| 2015 | $3,632 | $361,800 | $131,100 | $230,700 |
Source: Public Records
Map
Nearby Homes
- 26 Howes Rd
- 8 Holly Ln
- 8 Rogers Ave
- 55 Aspinet Rd
- 16 Peregrine Ln
- 31 Gardiner Ln
- 55 Pawkannawkut Dr
- 69 Pine Grove Rd
- 27 Wilfin Rd
- 21 Lyndale Rd
- 844 Route 28 Unit 1C
- 844 Route 28 Unit 1C
- 844 Route 28 Unit 9B
- 135 S Shore Dr Unit 17
- 135 S South Shore Dr Unit 17
- 9 Cedar St
- 4 Braddock St
- 30 Nauset Ln
- 7 Circuit Rd W
- 89 Acres Ave
- 45 Mattachee Rd
- 51 Mattachee Rd
- 41 Mattachee Rd
- 52 Eldridge Rd
- 48 Eldridge Rd
- 54 Eldridge Rd
- 46 Eldridge Rd
- 39 Mattachee Rd
- 57 Mattachee Rd
- 57 Mattachee Rd Unit 2
- 58 Eldridge Rd
- 2 Crow Rd
- 50 Mattachee Rd
- 54 Mattachee Rd
- 44 Mattachee Rd
- 35 Mattachee Rd
- 58 Mattachee Rd
- 38 Eldridge Rd
- 40 Mattachee Rd
- 24 Crow St