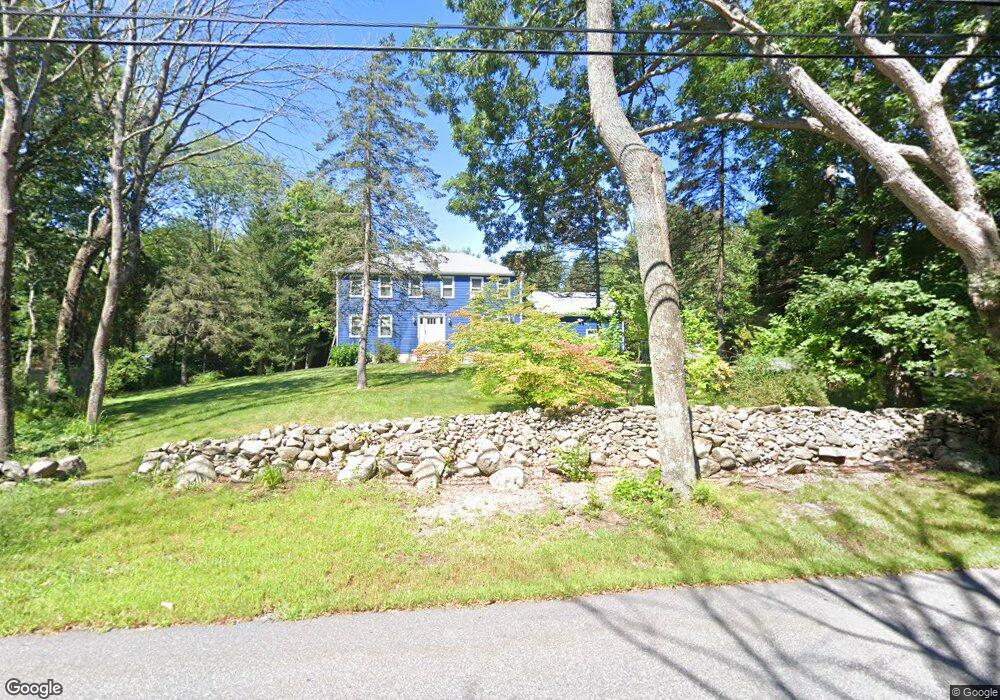
47 Milk St Blackstone, MA 01504
Estimated Value: $531,299 - $692,000
4
Beds
3
Baths
2,080
Sq Ft
$285/Sq Ft
Est. Value
About This Home
This home is located at 47 Milk St, Blackstone, MA 01504 and is currently estimated at $593,325, approximately $285 per square foot. 47 Milk St is a home located in Worcester County with nearby schools including Blackstone-Millville Regional High School.
Ownership History
Date
Name
Owned For
Owner Type
Purchase Details
Closed on
Mar 17, 2016
Sold by
Hall Glenda K and Sousa Michael E
Bought by
Sousa Michael E and Sousa Glenda K
Current Estimated Value
Purchase Details
Closed on
Feb 22, 1993
Sold by
Citicorp Mtg Inc
Bought by
Sousa Michael E and Hall Glenda
Home Financials for this Owner
Home Financials are based on the most recent Mortgage that was taken out on this home.
Original Mortgage
$105,000
Interest Rate
8.06%
Mortgage Type
Purchase Money Mortgage
Purchase Details
Closed on
Oct 1, 1992
Sold by
Dugas David A
Bought by
Citicorp Mtg Inc
Purchase Details
Closed on
Aug 31, 1988
Sold by
Owen Richard L
Bought by
Dugas D A
Home Financials for this Owner
Home Financials are based on the most recent Mortgage that was taken out on this home.
Original Mortgage
$162,300
Interest Rate
10.38%
Mortgage Type
Purchase Money Mortgage
Create a Home Valuation Report for This Property
The Home Valuation Report is an in-depth analysis detailing your home's value as well as a comparison with similar homes in the area
Home Values in the Area
Average Home Value in this Area
Purchase History
| Date | Buyer | Sale Price | Title Company |
|---|---|---|---|
| Sousa Michael E | -- | -- | |
| Sousa Michael E | $161,900 | -- | |
| Citicorp Mtg Inc | $120,400 | -- | |
| Dugas D A | $202,900 | -- |
Source: Public Records
Mortgage History
| Date | Status | Borrower | Loan Amount |
|---|---|---|---|
| Previous Owner | Dugas D A | $50,000 | |
| Previous Owner | Dugas D A | $8,700 | |
| Previous Owner | Dugas D A | $105,000 | |
| Previous Owner | Dugas D A | $162,300 |
Source: Public Records
Tax History Compared to Growth
Tax History
| Year | Tax Paid | Tax Assessment Tax Assessment Total Assessment is a certain percentage of the fair market value that is determined by local assessors to be the total taxable value of land and additions on the property. | Land | Improvement |
|---|---|---|---|---|
| 2025 | $7,025 | $465,200 | $156,400 | $308,800 |
| 2024 | $7,120 | $436,000 | $164,200 | $271,800 |
| 2023 | $6,600 | $407,900 | $164,200 | $243,700 |
| 2022 | $6,648 | $371,400 | $146,600 | $224,800 |
| 2021 | $4,814 | $352,600 | $146,600 | $206,000 |
| 2020 | $6,821 | $350,800 | $146,900 | $203,900 |
| 2019 | $6,473 | $342,300 | $138,400 | $203,900 |
| 2018 | $6,243 | $320,300 | $135,600 | $184,700 |
| 2017 | $6,021 | $312,600 | $140,300 | $172,300 |
| 2016 | $5,711 | $295,300 | $117,000 | $178,300 |
| 2015 | $5,525 | $283,600 | $110,300 | $173,300 |
Source: Public Records
Map
Nearby Homes
- 57 Milk St
- 25 Milk St
- 227 Blackstone St
- 1, 3, 5 Old Lincoln St
- 183-183R Mendon St
- 162 Blackstone St
- 244 Mendon St
- 160 Federal St
- 40 Union St
- 24 Reilly Ave
- 160 Thayer St
- Lot 1 Pickering Rd
- Lot 5 Pickering Rd
- Lot 2 Pickering Rd
- Lot 4 Pickering Rd
- Lot 3 Pickering Rd
- 69 Adj Hill St
- 70 Hill St
- 15 Blackstone St
- 41 Thayer St