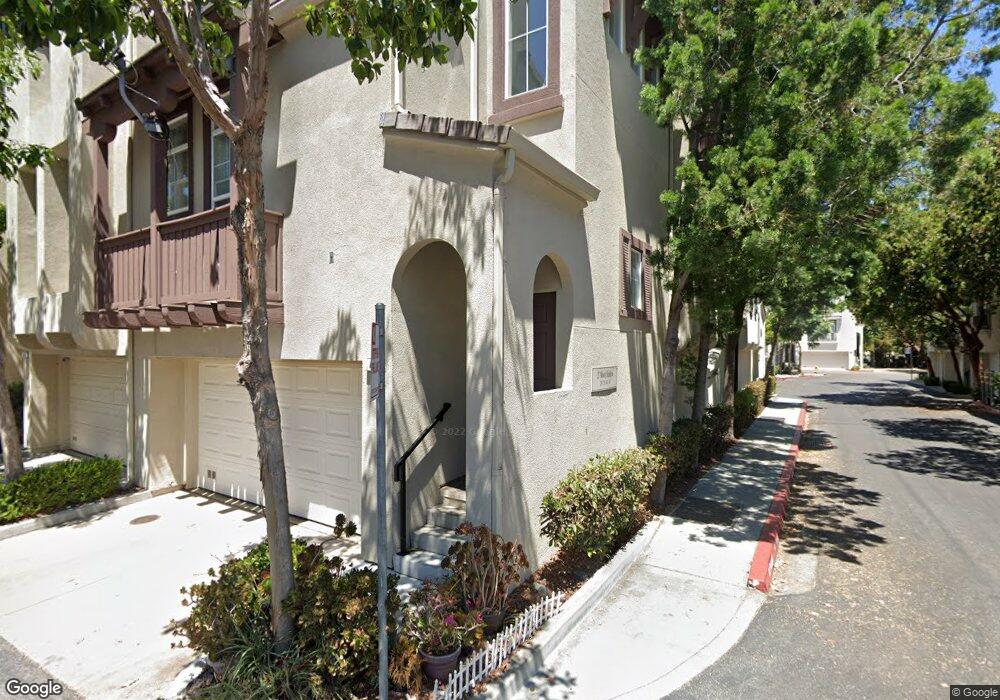
47 Moon Shadow Dr Milpitas, CA 95035
Estimated Value: $1,055,000 - $1,131,000
2
Beds
3
Baths
1,534
Sq Ft
$714/Sq Ft
Est. Value
About This Home
This home is located at 47 Moon Shadow Dr, Milpitas, CA 95035 and is currently estimated at $1,095,482, approximately $714 per square foot. 47 Moon Shadow Dr is a home located in Santa Clara County with nearby schools including Mabel Mattos Elementary School, Rancho Milpitas Middle School, and Milpitas High School.
Ownership History
Date
Name
Owned For
Owner Type
Purchase Details
Closed on
Apr 8, 2002
Sold by
Rgcclpo Development Co Llc
Bought by
Juria Eric
Current Estimated Value
Home Financials for this Owner
Home Financials are based on the most recent Mortgage that was taken out on this home.
Original Mortgage
$354,400
Outstanding Balance
$147,544
Interest Rate
6.87%
Estimated Equity
$947,938
Create a Home Valuation Report for This Property
The Home Valuation Report is an in-depth analysis detailing your home's value as well as a comparison with similar homes in the area
Home Values in the Area
Average Home Value in this Area
Purchase History
We collect this data history from publicly available records. To have your information removed, we recommend requesting removal directly through your county’s website.
| Date | Buyer | Sale Price | Title Company |
|---|---|---|---|
| Juria Eric | $443,500 | North American Title Co |
Source: Public Records
Mortgage History
We collect this data history from publicly available records. To have your information removed, we recommend requesting removal directly through your county’s website.
| Date | Status | Borrower | Loan Amount |
|---|---|---|---|
| Open | Juria Eric | $354,400 |
Source: Public Records
Tax History
| Year | Tax Paid | Tax Assessment Tax Assessment Total Assessment is a certain percentage of the fair market value that is determined by local assessors to be the total taxable value of land and additions on the property. | Land | Improvement |
|---|---|---|---|---|
| 2025 | $7,479 | $654,422 | $221,584 | $432,838 |
| 2024 | $7,479 | $641,591 | $217,240 | $424,351 |
| 2023 | $7,454 | $629,012 | $212,981 | $416,031 |
| 2022 | $7,426 | $616,679 | $208,805 | $407,874 |
| 2021 | $7,318 | $604,588 | $204,711 | $399,877 |
| 2020 | $7,191 | $598,389 | $202,612 | $395,777 |
| 2019 | $7,109 | $586,657 | $198,640 | $388,017 |
| 2018 | $6,751 | $575,155 | $194,746 | $380,409 |
| 2017 | $6,664 | $563,878 | $190,928 | $372,950 |
| 2016 | $6,393 | $552,823 | $187,185 | $365,638 |
| 2015 | $6,328 | $544,520 | $184,374 | $360,146 |
| 2014 | $6,154 | $533,855 | $180,763 | $353,092 |
Source: Public Records
Map
Nearby Homes
- 40 Moon Shadow Dr Unit 282
- 62 Parc Place Dr Unit RU3207
- 45 Parc Place Dr Unit RU2808
- 800 S Abel St Unit 519
- 800 S Abel St Unit 401
- 815 Towne Dr
- 1101 S Main St Unit 222
- 1101 S Main St Unit 402
- 1101 S Main St Unit 212
- 1101 S Main St Unit 216
- 658 S Main St
- 700 S Abel St Unit 415
- 700 S Abel St Unit 317
- 700 S Abel St Unit 417
- 682 Ohlone St
- 662 Ohlone St
- 648 S Main St
- 1094 Mente Linda Loop
- 760 Mente Linda Loop
- 915 Ternura Loop
- 61 Rain Walk
- 55 Rain Walk Unit 302
- 62 Sun Song Unit 290
- 68 Sun Song Unit 289
- 49 Rain Walk
- 56 Sun Song Unit 291
- 50 Sun Song
- 54 Rain Walk Unit 305
- 43 Rain Walk
- 44 Sun Song Unit 293
- 48 Rain Walk Unit 306
- 37 Rain Walk Unit 299
- 42 Rain Walk
- 38 Sun Song
- 936 Rain Dance
- 31 Rain Walk Unit 298
- 937 Rain Dance Unit 277
- 53 Wind Song Unit 316
- 36 Rain Walk Unit 308
- 47 Wind Song Unit 315
Your Personal Tour Guide
Ask me questions while you tour the home.