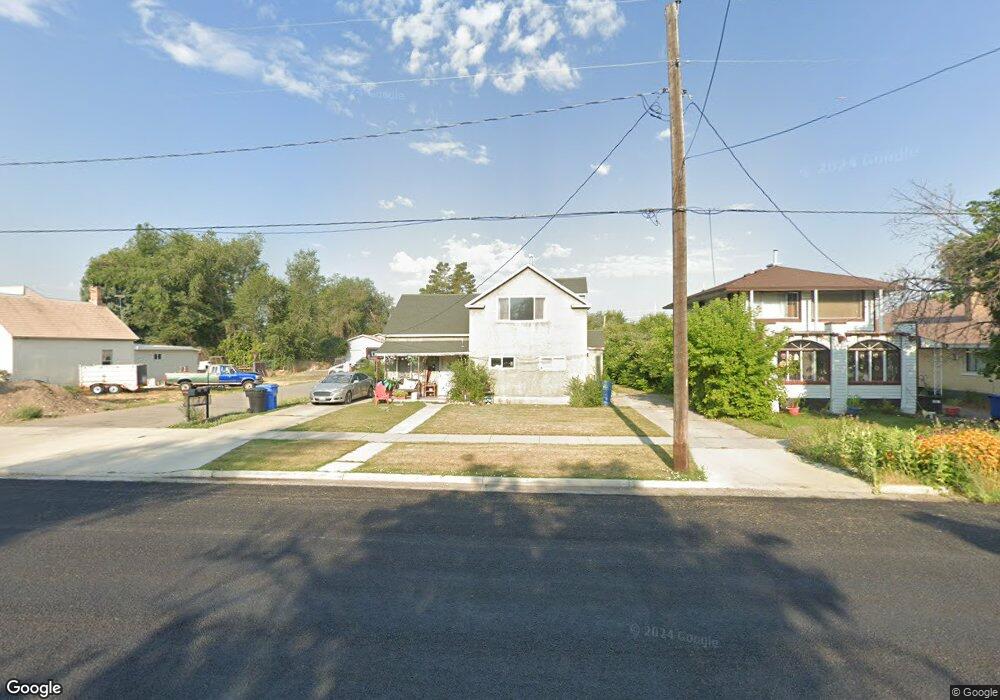
47 N 500 W Logan, UT 84321
Ellis NeighborhoodEstimated Value: $436,000 - $479,000
Studio
--
Bath
1,725
Sq Ft
$265/Sq Ft
Est. Value
About This Home
This home is located at 47 N 500 W, Logan, UT 84321 and is currently estimated at $457,928, approximately $265 per square foot. 47 N 500 W is a home with nearby schools including Ellis School, Mount Logan Middle School, and Logan High School.
Ownership History
Date
Name
Owned For
Owner Type
Purchase Details
Closed on
Jul 5, 2023
Sold by
Horlacher Thomas and Horlacher Thomas Carl
Bought by
Betty Horlacher Living Trust and Horlacher
Current Estimated Value
Purchase Details
Closed on
Feb 19, 2020
Sold by
Horlache Thomas C
Bought by
Horlacher Thomas C
Purchase Details
Closed on
Jun 14, 2019
Sold by
Horlacher Thomas C
Bought by
Horlacher Thomas C
Purchase Details
Closed on
Nov 14, 2013
Sold by
Stoneridge Apartments Llc
Bought by
Horlacher Thomas C
Create a Home Valuation Report for This Property
The Home Valuation Report is an in-depth analysis detailing your home's value as well as a comparison with similar homes in the area
Home Values in the Area
Average Home Value in this Area
Purchase History
| Date | Buyer | Sale Price | Title Company |
|---|---|---|---|
| Betty Horlacher Living Trust | -- | None Listed On Document | |
| Horlacher Thomas C | -- | None Available | |
| Horlacher Thomas C | -- | Advanced Title | |
| Horlacher Thomas C | -- | Advanced Title |
Source: Public Records
Tax History
| Year | Tax Paid | Tax Assessment Tax Assessment Total Assessment is a certain percentage of the fair market value that is determined by local assessors to be the total taxable value of land and additions on the property. | Land | Improvement |
|---|---|---|---|---|
| 2025 | $2,286 | $295,595 | $0 | $0 |
| 2023 | $982 | $117,300 | $0 | $0 |
| 2022 | $1,052 | $117,300 | $0 | $0 |
| 2021 | $668 | $63,300 | $42,000 | $21,300 |
| 2020 | $493 | $42,000 | $42,000 | $0 |
| 2019 | $515 | $42,000 | $42,000 | $0 |
| 2018 | $564 | $42,000 | $42,000 | $0 |
| 2017 | $587 | $42,000 | $0 | $0 |
| 2016 | $608 | $32,000 | $0 | $0 |
| 2015 | $464 | $32,000 | $0 | $0 |
| 2014 | $432 | $33,000 | $0 | $0 |
Source: Public Records
Map
Nearby Homes
Your Personal Tour Guide
Ask me questions while you tour the home.