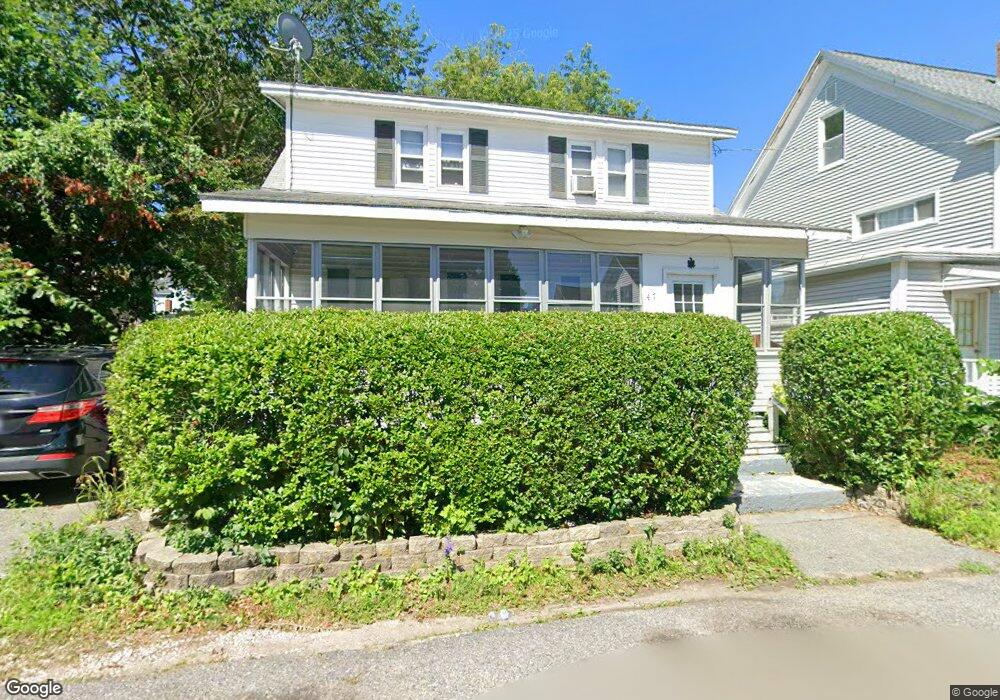
47 New Spaulding St Lowell, MA 01851
Lower Highlands NeighborhoodEstimated Value: $362,000 - $538,000
3
Beds
1
Bath
1,568
Sq Ft
$306/Sq Ft
Est. Value
About This Home
This home is located at 47 New Spaulding St, Lowell, MA 01851 and is currently estimated at $479,664, approximately $305 per square foot. 47 New Spaulding St is a home located in Middlesex County with nearby schools including Abraham Lincoln Elementary School, Charles W. Morey Elementary School, and Dr. Gertrude Bailey Elementary School.
Ownership History
Date
Name
Owned For
Owner Type
Purchase Details
Closed on
Oct 1, 2008
Sold by
Howard Nancy Lynn
Bought by
Foley Brian D and Marotta Danielle A
Current Estimated Value
Home Financials for this Owner
Home Financials are based on the most recent Mortgage that was taken out on this home.
Original Mortgage
$156,992
Interest Rate
6.54%
Mortgage Type
Purchase Money Mortgage
Purchase Details
Closed on
Apr 28, 2000
Sold by
Est Landry Marion and Landry Diane M
Bought by
Howard Nancy Lynn
Create a Home Valuation Report for This Property
The Home Valuation Report is an in-depth analysis detailing your home's value as well as a comparison with similar homes in the area
Home Values in the Area
Average Home Value in this Area
Purchase History
| Date | Buyer | Sale Price | Title Company |
|---|---|---|---|
| Foley Brian D | $158,000 | -- | |
| Foley Brian D | $158,000 | -- | |
| Foley Brian D | $158,000 | -- | |
| Howard Nancy Lynn | $117,000 | -- | |
| Howard Nancy Lynn | $117,000 | -- |
Source: Public Records
Mortgage History
| Date | Status | Borrower | Loan Amount |
|---|---|---|---|
| Open | Howard Nancy Lynn | $159,346 | |
| Closed | Foley Brian D | $156,992 |
Source: Public Records
Tax History Compared to Growth
Tax History
| Year | Tax Paid | Tax Assessment Tax Assessment Total Assessment is a certain percentage of the fair market value that is determined by local assessors to be the total taxable value of land and additions on the property. | Land | Improvement |
|---|---|---|---|---|
| 2025 | $4,721 | $411,200 | $155,400 | $255,800 |
| 2024 | $4,537 | $380,900 | $139,900 | $241,000 |
| 2023 | $4,263 | $343,200 | $121,600 | $221,600 |
| 2022 | $3,991 | $314,500 | $110,600 | $203,900 |
| 2021 | $3,719 | $276,300 | $96,200 | $180,100 |
| 2020 | $3,407 | $255,000 | $84,000 | $171,000 |
| 2019 | $3,170 | $225,800 | $77,800 | $148,000 |
| 2018 | $3,051 | $212,000 | $70,800 | $141,200 |
| 2017 | $2,935 | $196,700 | $64,400 | $132,300 |
| 2016 | $2,764 | $182,300 | $61,300 | $121,000 |
| 2015 | $2,703 | $174,600 | $62,700 | $111,900 |
| 2013 | $2,603 | $173,400 | $75,000 | $98,400 |
Source: Public Records
Map
Nearby Homes