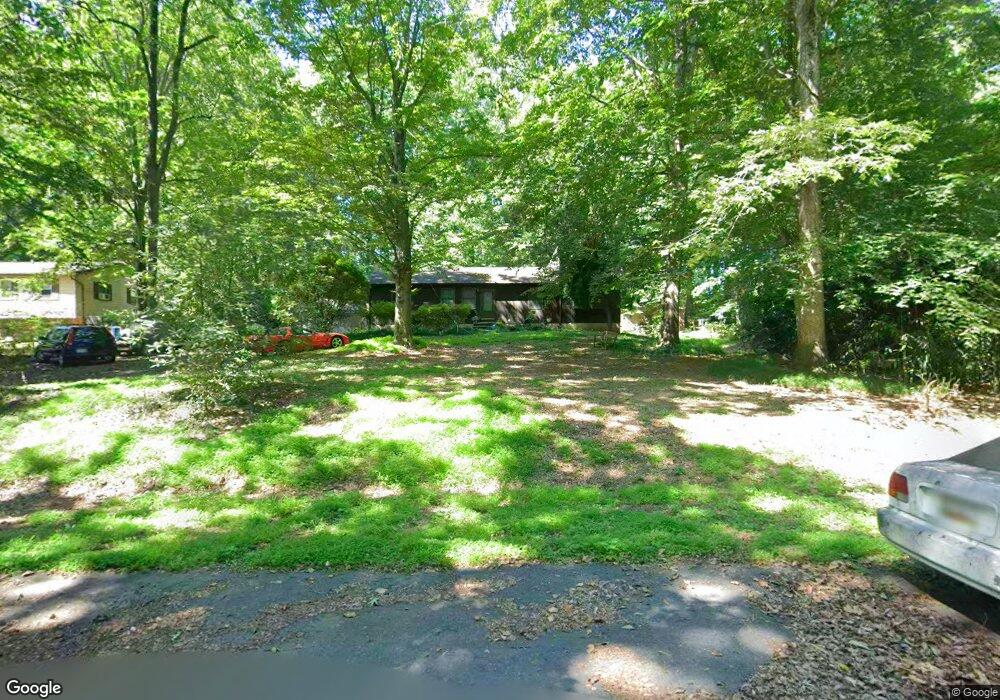
47 Oakridge Ct Elkton, MD 21921
Estimated Value: $282,351 - $353,000
Studio
2
Baths
1,260
Sq Ft
$240/Sq Ft
Est. Value
About This Home
This home is located at 47 Oakridge Ct, Elkton, MD 21921 and is currently estimated at $302,588, approximately $240 per square foot. 47 Oakridge Ct is a home located in Cecil County with nearby schools including Cecil Manor Elementary School, Cherry Hill Middle School, and Elkton High School.
Ownership History
Date
Name
Owned For
Owner Type
Purchase Details
Closed on
Jan 23, 2017
Bought by
Wilber Andrew
Current Estimated Value
Home Financials for this Owner
Home Financials are based on the most recent Mortgage that was taken out on this home.
Original Mortgage
$112,383
Outstanding Balance
$92,534
Interest Rate
4.09%
Estimated Equity
$210,054
Purchase Details
Closed on
Jun 28, 2005
Sold by
Botsford Jeffrey P
Bought by
Wilbur Andrew M and Johnson Wilbur Vickie J
Purchase Details
Closed on
Oct 12, 1999
Sold by
Botsford Jeffrey P
Bought by
Wilbur Andrew M and Johnson Wilbur Vickie J
Purchase Details
Closed on
Sep 2, 1999
Sold by
Botsford Jeffrey P and Botsford Juliann
Bought by
Botsford Jeffrey P
Purchase Details
Closed on
May 29, 1997
Sold by
Lampo Steven M and Lampo Lori A
Bought by
Botsford Jeffrey P and Botsford Juliann
Create a Home Valuation Report for This Property
The Home Valuation Report is an in-depth analysis detailing your home's value as well as a comparison with similar homes in the area
Home Values in the Area
Average Home Value in this Area
Purchase History
| Date | Buyer | Sale Price | Title Company |
|---|---|---|---|
| Wilber Andrew | -- | -- | |
| Wilbur Andrew M | $116,000 | None Available | |
| Wilbur Andrew M | $116,000 | -- | |
| Botsford Jeffrey P | -- | -- | |
| Botsford Jeffrey P | $112,000 | -- |
Source: Public Records
Mortgage History
| Date | Status | Borrower | Loan Amount |
|---|---|---|---|
| Open | Wilbur Andrew M | $112,383 | |
| Closed | Wilbur Andrew M | -- | |
| Closed | Botsford Jeffrey P | -- |
Source: Public Records
Tax History
| Year | Tax Paid | Tax Assessment Tax Assessment Total Assessment is a certain percentage of the fair market value that is determined by local assessors to be the total taxable value of land and additions on the property. | Land | Improvement |
|---|---|---|---|---|
| 2025 | $2,169 | $200,900 | $63,100 | $137,800 |
| 2024 | $1,765 | $191,667 | $0 | $0 |
| 2023 | $1,322 | $182,433 | $0 | $0 |
| 2022 | $1,981 | $173,200 | $63,100 | $110,100 |
| 2021 | $1,941 | $167,367 | $0 | $0 |
| 2020 | $1,893 | $161,533 | $0 | $0 |
| 2019 | $1,826 | $155,700 | $63,100 | $92,600 |
| 2018 | $1,800 | $153,500 | $0 | $0 |
| 2017 | $1,775 | $151,300 | $0 | $0 |
| 2016 | $1,674 | $149,100 | $0 | $0 |
| 2015 | $1,674 | $149,100 | $0 | $0 |
| 2014 | $1,585 | $149,100 | $0 | $0 |
Source: Public Records
Map
Nearby Homes
- 54 Oakridge Ct
- 34 Cherry Ln
- 70 Willow Ct
- 43 Mule Deer Ct
- 203 Fletchwood Rd
- 28 Buttercup Cir
- 11 Buttercup Cir
- 57 Gypsum Dr Unit 195
- 305 Kinross Dr
- 23 Maple Dr Unit 16
- 117 W Shetland Ct
- 7 E Galloway Ct
- 8 Arizona State Dr
- 153 King William St Unit 153
- 313 Chickory Way
- 48 Arizona State Dr
- 507 Leahy Dr
- 30 Julie Ln
- 405 Leahy Dr
- 0001 Leahy Dr
- 43 Oakridge Ct
- 51 Oakridge Ct
- 48 Oakridge Ct
- 38 Oakridge Ct
- 39 Oakridge Ct
- 55 Oakridge Ct
- 1216 Appleton Rd
- 1218 Appleton Rd
- 33 Oakridge Ct
- 1184 Appleton Rd
- 1184 Appleton Rd
- 1204 Appleton Rd
- 1180 Appleton Rd
- 27 Oakridge Ct
- 1210 Appleton Rd
- 26 Oakridge Ct
- 1226 Appleton Rd
- 1166 Appleton Rd
- 23 Oakridge Ct
- 20 Oakridge Ct
Your Personal Tour Guide
Ask me questions while you tour the home.