47 Peyster St Albany, NY 12208
Pine Hills NeighborhoodEstimated Value: $270,000 - $316,000
4
Beds
2
Baths
1,949
Sq Ft
$153/Sq Ft
Est. Value
About This Home
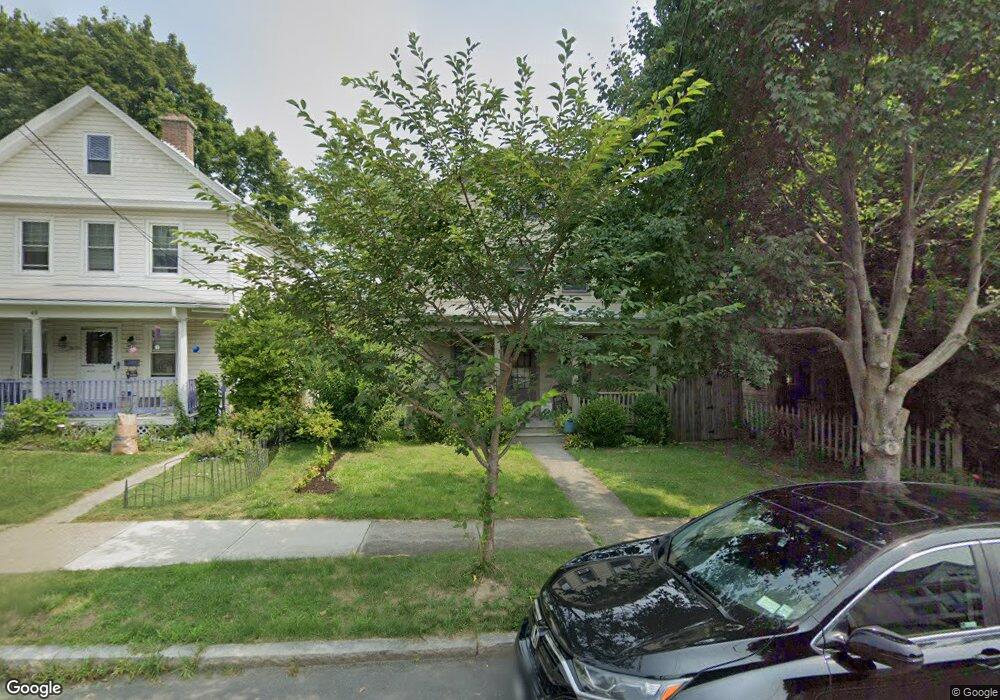
This home is located at 47 Peyster St, Albany, NY 12208 and is currently estimated at $298,637, approximately $153 per square foot. 47 Peyster St is a home located in Albany County with nearby schools including Pine Hills Elementary School, Stephen And Harriet Myers Middle School, and Albany High School.
Ownership History
Date
Name
Owned For
Owner Type
Purchase Details
Closed on
Sep 1, 2016
Sold by
Dansereau Raymond N
Bought by
Dansereau Raymond J and Dansereau Erin K
Current Estimated Value
Purchase Details
Closed on
Jun 20, 2006
Sold by
Komar Rajan
Bought by
Fitgerald Shawn P
Home Financials for this Owner
Home Financials are based on the most recent Mortgage that was taken out on this home.
Original Mortgage
$167,840
Interest Rate
6.71%
Mortgage Type
New Conventional
Purchase Details
Closed on
Feb 26, 2003
Sold by
Siegel Sharon
Bought by
Kumar Rajan
Create a Home Valuation Report for This Property
The Home Valuation Report is an in-depth analysis detailing your home's value as well as a comparison with similar homes in the area
Home Values in the Area
Average Home Value in this Area
Purchase History
| Date | Buyer | Sale Price | Title Company |
|---|---|---|---|
| Dansereau Raymond J | $158,100 | None Available | |
| Fitgerald Shawn P | $173,040 | Eller Block Coluci Spellman | |
| Fitzgerald Shawn P | $173,500 | None Available | |
| Kumar Rajan | $119,000 | Peter Reilly |
Source: Public Records
Mortgage History
| Date | Status | Borrower | Loan Amount |
|---|---|---|---|
| Previous Owner | Fitzgerald Shawn P | $167,840 |
Source: Public Records
Tax History Compared to Growth
Tax History
| Year | Tax Paid | Tax Assessment Tax Assessment Total Assessment is a certain percentage of the fair market value that is determined by local assessors to be the total taxable value of land and additions on the property. | Land | Improvement |
|---|---|---|---|---|
| 2024 | $5,623 | $235,000 | $47,000 | $188,000 |
| 2023 | $5,990 | $163,000 | $33,000 | $130,000 |
| 2022 | $5,781 | $163,000 | $33,000 | $130,000 |
| 2021 | $5,743 | $163,000 | $33,000 | $130,000 |
| 2020 | $5,547 | $163,000 | $33,000 | $130,000 |
| 2019 | $6,417 | $163,000 | $33,000 | $130,000 |
| 2018 | $5,549 | $163,000 | $33,000 | $130,000 |
| 2017 | $2,366 | $163,000 | $33,000 | $130,000 |
| 2016 | $5,388 | $163,000 | $33,000 | $130,000 |
| 2015 | $5,607 | $168,000 | $34,700 | $133,300 |
| 2014 | -- | $168,000 | $34,700 | $133,300 |
Source: Public Records
Map
Nearby Homes