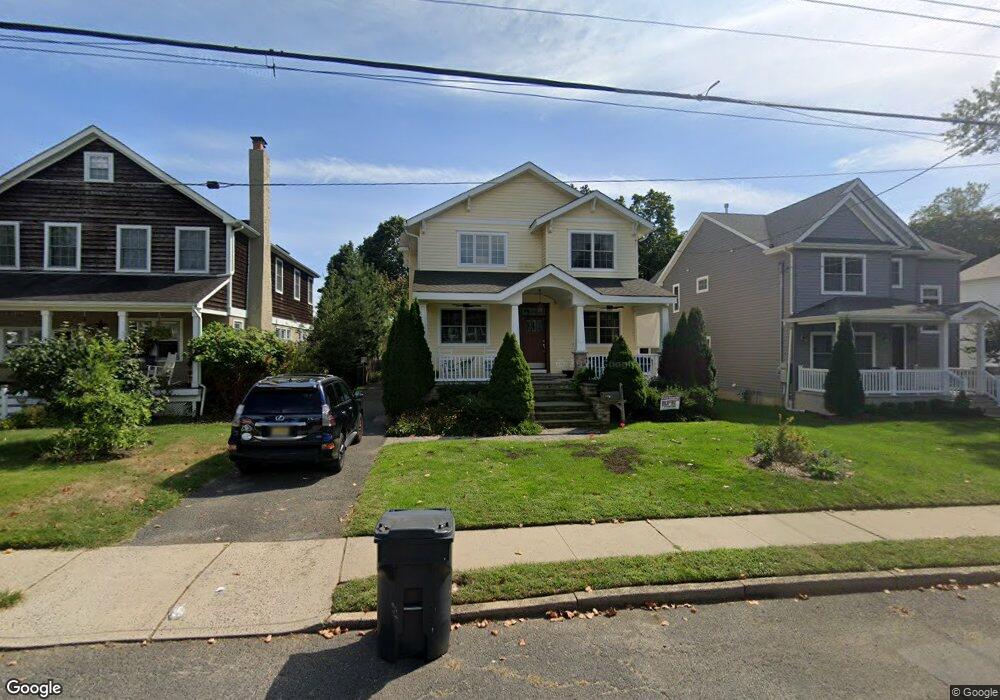
47 Poplar Ave Fair Haven, NJ 07704
Estimated Value: $1,577,000 - $1,772,000
4
Beds
2
Baths
2,396
Sq Ft
$684/Sq Ft
Est. Value
About This Home
This home is located at 47 Poplar Ave, Fair Haven, NJ 07704 and is currently estimated at $1,639,869, approximately $684 per square foot. 47 Poplar Ave is a home located in Monmouth County with nearby schools including Viola L Sickles School, Knollwood School, and Rumson Fair Haven Regional High School.
Ownership History
Date
Name
Owned For
Owner Type
Purchase Details
Closed on
Jul 8, 2011
Sold by
Ern Kenneth and Ern Gina
Bought by
Ern Gina
Current Estimated Value
Purchase Details
Closed on
May 28, 2008
Sold by
Genesis Associates Inc
Bought by
Ern Kenneth and Ern Gina
Home Financials for this Owner
Home Financials are based on the most recent Mortgage that was taken out on this home.
Original Mortgage
$240,000
Outstanding Balance
$154,479
Interest Rate
6.11%
Mortgage Type
Purchase Money Mortgage
Estimated Equity
$1,485,390
Purchase Details
Closed on
May 15, 2007
Sold by
Hodgkiss Ann
Bought by
Genesis Associates Inc
Create a Home Valuation Report for This Property
The Home Valuation Report is an in-depth analysis detailing your home's value as well as a comparison with similar homes in the area
Home Values in the Area
Average Home Value in this Area
Purchase History
| Date | Buyer | Sale Price | Title Company |
|---|---|---|---|
| Ern Gina | -- | Multiple | |
| Ern Kenneth | $825,000 | Scott Title Services Llc | |
| Genesis Associates Inc | $374,900 | Stewart Title Guaranty Co |
Source: Public Records
Mortgage History
| Date | Status | Borrower | Loan Amount |
|---|---|---|---|
| Open | Ern Kenneth | $240,000 |
Source: Public Records
Tax History Compared to Growth
Tax History
| Year | Tax Paid | Tax Assessment Tax Assessment Total Assessment is a certain percentage of the fair market value that is determined by local assessors to be the total taxable value of land and additions on the property. | Land | Improvement |
|---|---|---|---|---|
| 2025 | $18,054 | $1,327,900 | $671,700 | $656,200 |
| 2024 | $17,451 | $1,229,000 | $576,700 | $652,300 |
| 2023 | $17,451 | $1,108,700 | $471,700 | $637,000 |
| 2022 | $16,738 | $1,007,500 | $393,400 | $614,100 |
| 2021 | $16,738 | $902,300 | $350,700 | $551,600 |
| 2020 | $16,360 | $887,700 | $335,700 | $552,000 |
| 2019 | $16,146 | $884,700 | $335,700 | $549,000 |
| 2018 | $16,121 | $865,300 | $335,700 | $529,600 |
| 2017 | $15,903 | $837,000 | $317,500 | $519,500 |
| 2016 | $15,789 | $807,600 | $295,300 | $512,300 |
| 2015 | $15,554 | $800,100 | $295,300 | $504,800 |
| 2014 | $15,362 | $780,600 | $294,400 | $486,200 |
Source: Public Records
Map
Nearby Homes