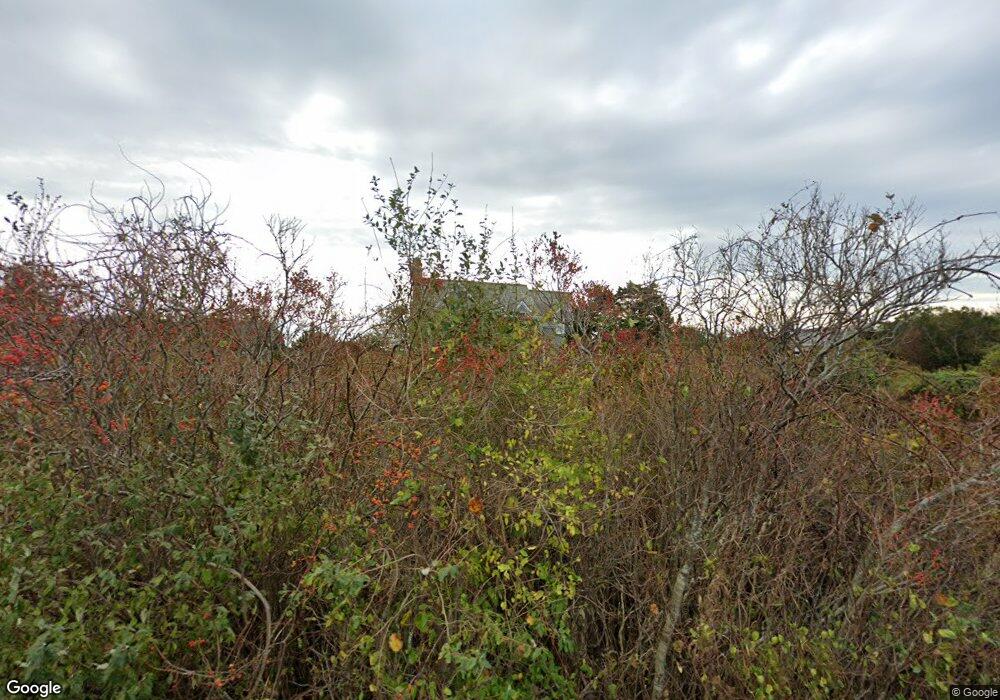
47 Quidnet Rd Nantucket, MA 02554
Estimated Value: $3,867,590 - $5,554,000
2
Beds
3
Baths
2,676
Sq Ft
$1,756/Sq Ft
Est. Value
About This Home
This home is located at 47 Quidnet Rd, Nantucket, MA 02554 and is currently estimated at $4,699,148, approximately $1,756 per square foot. 47 Quidnet Rd is a home located in Nantucket County with nearby schools including Nantucket Elementary School, Cyrus Peirce Middle School, and Nantucket High School.
Ownership History
Date
Name
Owned For
Owner Type
Purchase Details
Closed on
Jun 14, 2004
Sold by
Thomson Lynne P and Thomson Robert G
Bought by
Burbage Stephen W and Burbage Susan C
Current Estimated Value
Home Financials for this Owner
Home Financials are based on the most recent Mortgage that was taken out on this home.
Original Mortgage
$800,000
Outstanding Balance
$373,551
Interest Rate
5.99%
Mortgage Type
Purchase Money Mortgage
Estimated Equity
$4,325,597
Purchase Details
Closed on
Apr 7, 2000
Sold by
Harley Martha
Bought by
Thomson Lynne P and Thomson Robert G
Create a Home Valuation Report for This Property
The Home Valuation Report is an in-depth analysis detailing your home's value as well as a comparison with similar homes in the area
Home Values in the Area
Average Home Value in this Area
Purchase History
| Date | Buyer | Sale Price | Title Company |
|---|---|---|---|
| Burbage Stephen W | $2,500,000 | -- | |
| Burbage Stephen | $2,500,000 | -- | |
| Thomson Lynne P | $2,090,000 | -- | |
| Thomson Lynne | $2,090,000 | -- |
Source: Public Records
Mortgage History
| Date | Status | Borrower | Loan Amount |
|---|---|---|---|
| Open | Burbage Stephen | $800,000 | |
| Closed | Thomson Lynne P | $800,000 |
Source: Public Records
Tax History
| Year | Tax Paid | Tax Assessment Tax Assessment Total Assessment is a certain percentage of the fair market value that is determined by local assessors to be the total taxable value of land and additions on the property. | Land | Improvement |
|---|---|---|---|---|
| 2025 | $11,692 | $3,564,600 | $1,828,200 | $1,736,400 |
| 2024 | $11,578 | $3,698,900 | $1,987,200 | $1,711,700 |
| 2023 | $9,818 | $3,058,500 | $1,743,400 | $1,315,100 |
| 2022 | $7,944 | $2,124,000 | $1,143,900 | $980,100 |
| 2021 | $8,171 | $2,251,100 | $1,271,000 | $980,100 |
| 2020 | $7,944 | $2,302,600 | $1,271,000 | $1,031,600 |
| 2019 | $7,659 | $2,279,600 | $1,248,000 | $1,031,600 |
| 2018 | $8,301 | $2,351,500 | $1,422,700 | $928,800 |
| 2017 | $7,884 | $2,325,800 | $1,422,700 | $903,100 |
| 2016 | $7,560 | $2,250,100 | $1,372,800 | $877,300 |
| 2015 | $6,868 | $1,902,600 | $1,151,200 | $751,400 |
| 2014 | $7,087 | $1,884,800 | $1,133,400 | $751,400 |
Source: Public Records
Map
Nearby Homes
- 21 Quidnet Rd
- 5 Brier Patch Rd
- 13 Eat Fire Spring Rd
- 37 Sankaty Head Rd
- 6 Fargo Way
- 100 Baxter Rd
- 247 Polpis Rd
- 83 Baxter Rd
- 44 Sankaty Rd
- 8 Sconset Ave
- 11 Hydrangea Ln
- 318 Milestone Rd
- 3 Whitetail Cir
- 47 Morey Ln
- 27 Longwood Dr
- 31 Flintlock Rd
- 40 Low Beach Rd
- 13 Parson Ln
- 4 Berkley St
- 12 Ipswich St
Your Personal Tour Guide
Ask me questions while you tour the home.