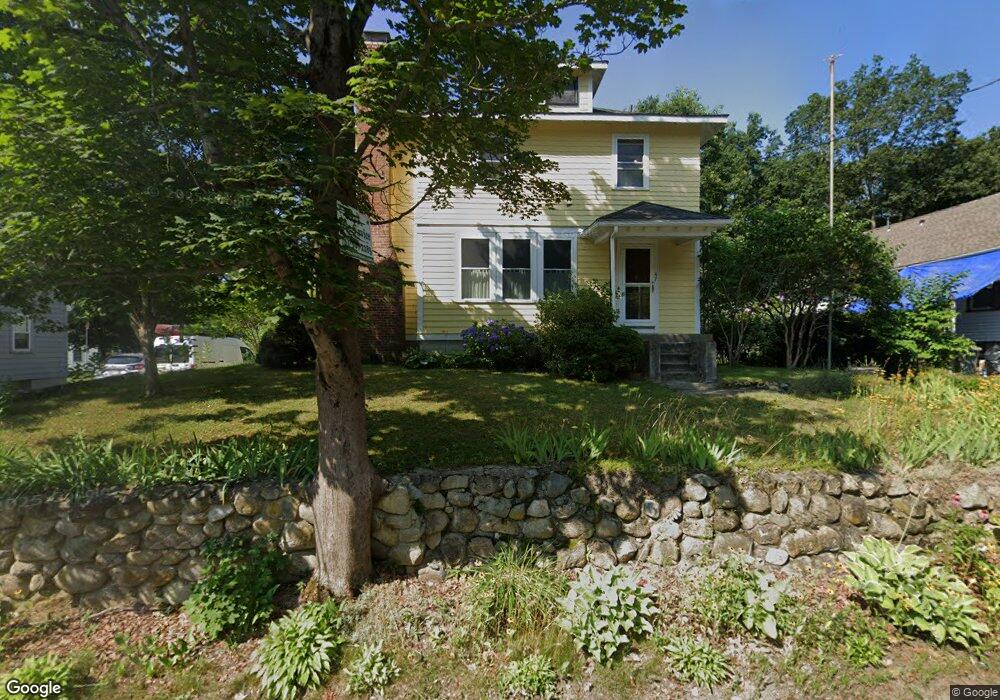
47 Simpson St Stoughton, MA 02072
Estimated Value: $456,000 - $575,000
3
Beds
2
Baths
1,632
Sq Ft
$325/Sq Ft
Est. Value
About This Home
This home is located at 47 Simpson St, Stoughton, MA 02072 and is currently estimated at $530,304, approximately $324 per square foot. 47 Simpson St is a home located in Norfolk County with nearby schools including Wilkins Elementary School, O'Donnell Middle School, and Stoughton High School.
Ownership History
Date
Name
Owned For
Owner Type
Purchase Details
Closed on
Jun 25, 1997
Sold by
Stewart Norman
Bought by
Racicot Mark G and Racicot Susan
Current Estimated Value
Home Financials for this Owner
Home Financials are based on the most recent Mortgage that was taken out on this home.
Original Mortgage
$65,000
Interest Rate
7.81%
Mortgage Type
Purchase Money Mortgage
Create a Home Valuation Report for This Property
The Home Valuation Report is an in-depth analysis detailing your home's value as well as a comparison with similar homes in the area
Home Values in the Area
Average Home Value in this Area
Purchase History
| Date | Buyer | Sale Price | Title Company |
|---|---|---|---|
| Racicot Mark G | $81,250 | -- | |
| Racicot Mark G | $81,250 | -- |
Source: Public Records
Mortgage History
| Date | Status | Borrower | Loan Amount |
|---|---|---|---|
| Open | Racicot Mark G | $103,000 | |
| Closed | Racicot Mark G | $30,000 | |
| Closed | Racicot Mark G | $10,000 | |
| Closed | Racicot Mark G | $65,000 |
Source: Public Records
Tax History
| Year | Tax Paid | Tax Assessment Tax Assessment Total Assessment is a certain percentage of the fair market value that is determined by local assessors to be the total taxable value of land and additions on the property. | Land | Improvement |
|---|---|---|---|---|
| 2025 | $5,956 | $481,100 | $213,800 | $267,300 |
| 2024 | $5,883 | $462,100 | $194,800 | $267,300 |
| 2023 | $5,710 | $421,400 | $181,000 | $240,400 |
| 2022 | $5,476 | $380,000 | $165,500 | $214,500 |
| 2021 | $5,096 | $337,500 | $150,000 | $187,500 |
| 2020 | $4,948 | $332,300 | $144,800 | $187,500 |
| 2019 | $4,806 | $313,300 | $144,800 | $168,500 |
| 2018 | $4,479 | $302,400 | $137,900 | $164,500 |
| 2017 | $4,027 | $277,900 | $131,000 | $146,900 |
| 2016 | $3,906 | $260,900 | $120,700 | $140,200 |
| 2015 | $3,843 | $254,000 | $113,800 | $140,200 |
| 2014 | $3,726 | $236,700 | $103,400 | $133,300 |
Source: Public Records
Map
Nearby Homes
- 65 Station St
- 52 Adams St
- 26 Faxon St Unit 2
- 293 School St
- 438 School St
- 138 Water St
- 30 Porter St
- 100 Water St
- 11 Monk St
- 15-17 Morton Square
- 58 Union St Unit 6
- 5 Trudy Terrace
- 32 Packard Rd
- 296 Island St
- 79 Kinsley St
- 12 Greenbrook Dr
- 36 Pleasant Dr Unit 42
- 73 Crescent Ave
- 53 Will Dr Unit 143
- 114 Powell St
Your Personal Tour Guide
Ask me questions while you tour the home.