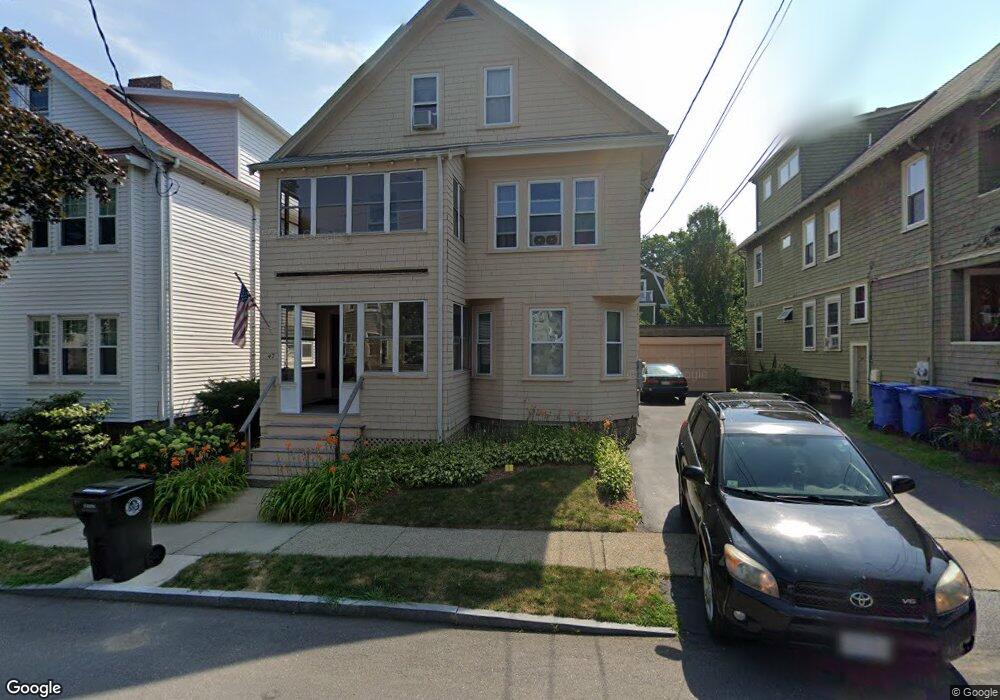
47 Springfield St Belmont, MA 02478
Cushing Square NeighborhoodEstimated Value: $663,000 - $1,613,940
5
Beds
2
Baths
2,562
Sq Ft
$456/Sq Ft
Est. Value
About This Home
This home is located at 47 Springfield St, Belmont, MA 02478 and is currently estimated at $1,167,235, approximately $455 per square foot. 47 Springfield St is a home located in Middlesex County with nearby schools including Roger Wellington Elementary School, Winthrop L Chenery Middle School, and Belmont High School.
Ownership History
Date
Name
Owned For
Owner Type
Purchase Details
Closed on
Apr 24, 1992
Sold by
Orfali Jiraire J
Bought by
Yazejian James H and Yazejian Gail M
Current Estimated Value
Home Financials for this Owner
Home Financials are based on the most recent Mortgage that was taken out on this home.
Original Mortgage
$207,000
Interest Rate
8.78%
Mortgage Type
Purchase Money Mortgage
Create a Home Valuation Report for This Property
The Home Valuation Report is an in-depth analysis detailing your home's value as well as a comparison with similar homes in the area
Home Values in the Area
Average Home Value in this Area
Purchase History
| Date | Buyer | Sale Price | Title Company |
|---|---|---|---|
| Yazejian James H | $230,000 | -- |
Source: Public Records
Mortgage History
| Date | Status | Borrower | Loan Amount |
|---|---|---|---|
| Closed | Yazejian James H | $207,000 |
Source: Public Records
Tax History Compared to Growth
Tax History
| Year | Tax Paid | Tax Assessment Tax Assessment Total Assessment is a certain percentage of the fair market value that is determined by local assessors to be the total taxable value of land and additions on the property. | Land | Improvement |
|---|---|---|---|---|
| 2025 | $16,185 | $1,421,000 | $682,000 | $739,000 |
| 2024 | $14,509 | $1,374,000 | $935,000 | $439,000 |
| 2023 | $14,398 | $1,281,000 | $882,000 | $399,000 |
| 2022 | $13,513 | $1,180,000 | $807,000 | $373,000 |
| 2021 | $6,931 | $1,171,000 | $799,000 | $372,000 |
| 2020 | $11,825 | $1,075,000 | $644,000 | $431,000 |
| 2019 | $6,389 | $934,000 | $494,000 | $440,000 |
| 2018 | $10,072 | $829,000 | $428,000 | $401,000 |
| 2017 | $9,467 | $746,000 | $353,000 | $393,000 |
| 2016 | $9,332 | $743,000 | $353,000 | $390,000 |
| 2015 | $8,075 | $626,000 | $315,000 | $311,000 |
Source: Public Records
Map
Nearby Homes
- 73 Foster Rd Unit 2
- 276 Belmont St Unit 1
- 30 Unity Ave Unit 30
- 147 Langdon Ave Unit 149
- 10 Marlboro St Unit 1
- 133 Hillside Rd
- 163 Belmont St
- 56-58 Edgecliff Rd
- 87 Templeton Pkwy Unit 3
- 16 Ericsson St
- 81 Winsor Ave
- 172 Maplewood St
- 161 Cushing St
- 43 Irma Ave Unit 43
- 1 Clayton St
- 25 Francis St Unit 2
- 25 Francis St Unit 1
- 95 Cushing St
- 66 Holworthy St
- 87 Holworthy St Unit 2
- 47 Springfield St Unit 2nd
- 47 Springfield St Unit 2
- 70 Fairview Ave
- 45 Springfield St Unit 2
- 45 Springfield St Unit 1
- 66 Fairview Ave
- 43 Springfield St
- 43 Springfield St Unit 1
- 50 Falmouth St
- 50 Falmouth St Unit st
- 50 Falmouth St Unit 1
- 74 Fairview Ave
- 72 Fairview Ave
- 72 Fairview Ave Unit 72
- 54 Falmouth St Unit 56
- 56 Falmouth St
- 54 Falmouth St Unit 2
- 60 Springfield St
- 58 Springfield St
- 60 Springfield St Unit 60