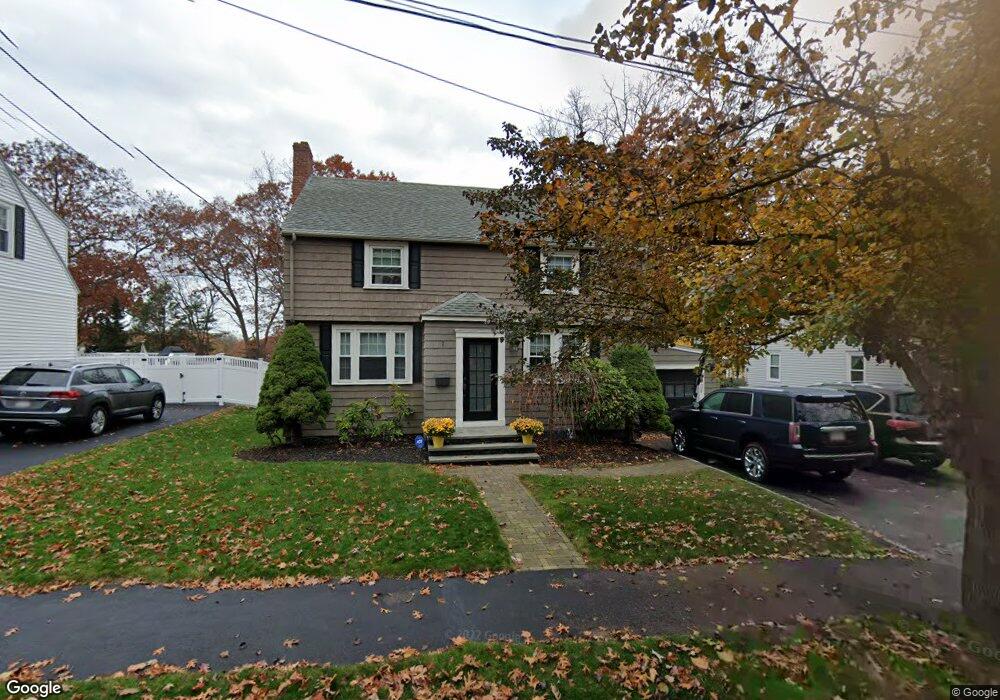
47 Stark Ave Wakefield, MA 01880
East Side NeighborhoodEstimated Value: $820,000 - $851,000
3
Beds
2
Baths
2,480
Sq Ft
$338/Sq Ft
Est. Value
About This Home
This home is located at 47 Stark Ave, Wakefield, MA 01880 and is currently estimated at $839,423, approximately $338 per square foot. 47 Stark Ave is a home located in Middlesex County with nearby schools including Wakefield Memorial High School, St Joseph School, and St. Patrick Elementary School.
Ownership History
Date
Name
Owned For
Owner Type
Purchase Details
Closed on
Jun 1, 2012
Sold by
Decamillis Rt
Bought by
Courtright Michael and Courtright Michele
Current Estimated Value
Home Financials for this Owner
Home Financials are based on the most recent Mortgage that was taken out on this home.
Original Mortgage
$288,000
Outstanding Balance
$200,248
Interest Rate
3.9%
Mortgage Type
New Conventional
Estimated Equity
$639,175
Create a Home Valuation Report for This Property
The Home Valuation Report is an in-depth analysis detailing your home's value as well as a comparison with similar homes in the area
Home Values in the Area
Average Home Value in this Area
Purchase History
| Date | Buyer | Sale Price | Title Company |
|---|---|---|---|
| Courtright Michael | $360,000 | -- |
Source: Public Records
Mortgage History
| Date | Status | Borrower | Loan Amount |
|---|---|---|---|
| Open | Courtright Michael | $288,000 |
Source: Public Records
Tax History
| Year | Tax Paid | Tax Assessment Tax Assessment Total Assessment is a certain percentage of the fair market value that is determined by local assessors to be the total taxable value of land and additions on the property. | Land | Improvement |
|---|---|---|---|---|
| 2025 | $8,359 | $736,500 | $389,600 | $346,900 |
| 2024 | $8,237 | $732,200 | $387,300 | $344,900 |
| 2023 | $7,843 | $668,600 | $353,200 | $315,400 |
| 2022 | $7,625 | $609,700 | $321,700 | $288,000 |
| 2021 | $7,625 | $599,000 | $299,900 | $299,100 |
| 2020 | $7,151 | $560,000 | $280,300 | $279,700 |
| 2019 | $6,831 | $532,400 | $266,500 | $265,900 |
| 2018 | $6,361 | $491,200 | $245,900 | $245,300 |
| 2017 | $5,981 | $459,000 | $229,800 | $229,200 |
| 2016 | $5,739 | $425,400 | $217,400 | $208,000 |
| 2015 | $5,365 | $398,000 | $203,100 | $194,900 |
| 2014 | $4,895 | $383,000 | $195,300 | $187,700 |
Source: Public Records
Map
Nearby Homes
- 34 Stark Ave
- 61 Nahant St
- 0 Everett St
- 21 Herbert St Unit A
- 1 Traverse St Unit E
- 35 Richardson St Unit 2
- 177 Oak St
- 1 Sidney St
- 10 Wakefield Ave Unit B
- 824 Main St Unit 1
- 43-45 Crescent St
- 68 Preston St Unit 6D
- 16 Pleasant St
- 69 Foundry St Unit 310
- 69 Foundry St Unit 416
- 62 Foundry St Unit 310
- 62 Foundry St Unit 204
- 62 Foundry St Unit 402
- 62 Foundry St Unit 507
- 62 Foundry St Unit 208
Your Personal Tour Guide
Ask me questions while you tour the home.