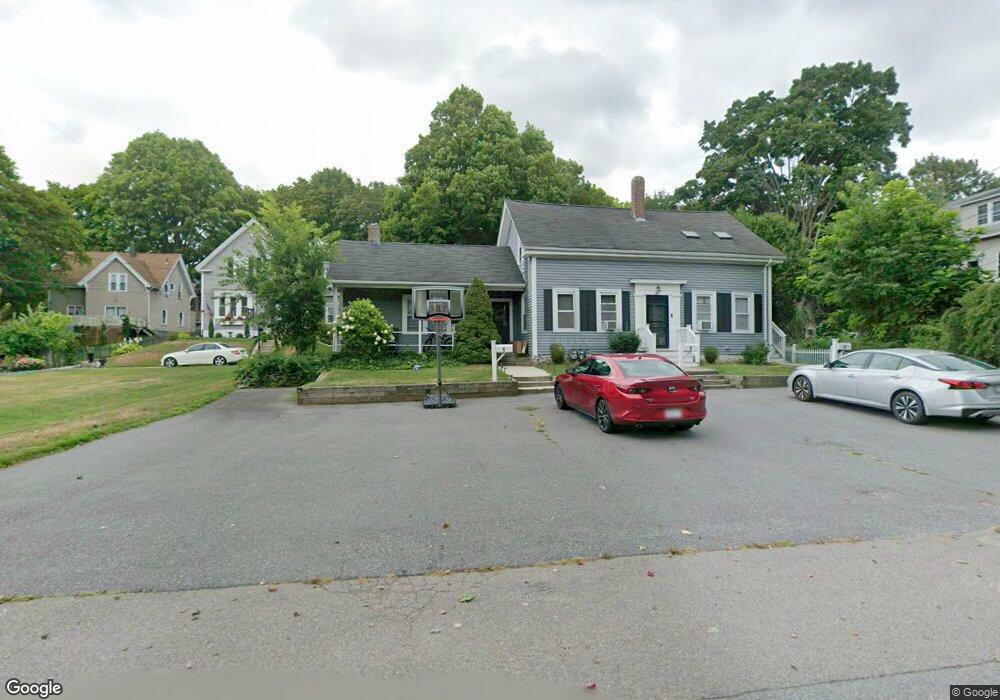
47 Sumner St North Attleboro, MA 02760
Estimated Value: $605,000 - $658,000
5
Beds
3
Baths
1,918
Sq Ft
$325/Sq Ft
Est. Value
About This Home
This home is located at 47 Sumner St, North Attleboro, MA 02760 and is currently estimated at $623,204, approximately $324 per square foot. 47 Sumner St is a home located in Bristol County with nearby schools including North Attleboro High School and Discovery Daycare Center.
Ownership History
Date
Name
Owned For
Owner Type
Purchase Details
Closed on
Sep 27, 2018
Sold by
Prew Gregory M
Bought by
Gregory M Prew Ft and Prew
Current Estimated Value
Purchase Details
Closed on
Jan 4, 2002
Sold by
Ruzicka Deava D
Bought by
Wootton Wade and Wootton Beverly
Home Financials for this Owner
Home Financials are based on the most recent Mortgage that was taken out on this home.
Original Mortgage
$191,250
Interest Rate
6.72%
Mortgage Type
Purchase Money Mortgage
Create a Home Valuation Report for This Property
The Home Valuation Report is an in-depth analysis detailing your home's value as well as a comparison with similar homes in the area
Home Values in the Area
Average Home Value in this Area
Purchase History
| Date | Buyer | Sale Price | Title Company |
|---|---|---|---|
| Gregory M Prew Ft | -- | None Available | |
| Wootton Wade | $255,000 | -- |
Source: Public Records
Mortgage History
| Date | Status | Borrower | Loan Amount |
|---|---|---|---|
| Previous Owner | Wootton Wade | $191,250 |
Source: Public Records
Tax History
| Year | Tax Paid | Tax Assessment Tax Assessment Total Assessment is a certain percentage of the fair market value that is determined by local assessors to be the total taxable value of land and additions on the property. | Land | Improvement |
|---|---|---|---|---|
| 2025 | $5,026 | $426,300 | $124,600 | $301,700 |
| 2024 | $4,920 | $426,300 | $124,600 | $301,700 |
| 2023 | $5,135 | $401,500 | $124,600 | $276,900 |
| 2022 | $4,884 | $350,600 | $124,600 | $226,000 |
| 2021 | $4,693 | $328,900 | $124,600 | $204,300 |
| 2020 | $3,920 | $273,200 | $124,600 | $148,600 |
| 2019 | $3,775 | $265,100 | $113,300 | $151,800 |
| 2018 | $3,552 | $266,300 | $113,300 | $153,000 |
| 2017 | $3,273 | $247,600 | $113,300 | $134,300 |
| 2016 | $3,253 | $246,100 | $125,900 | $120,200 |
| 2015 | $3,172 | $241,400 | $132,200 | $109,200 |
| 2014 | $3,105 | $234,500 | $122,200 | $112,300 |
Source: Public Records
Map
Nearby Homes
- 88 Arnold Rd
- 218 High St
- 16 Johnson St
- 84 Barrows St
- 16 Richards Ave Unit 306
- 16 Richards Ave Unit 204
- 23-R Eddy Street (Eddy St Rear)
- 173 S Washington St
- 3 Riley Ct
- 271 N Washington St
- 42 2nd Ave Unit 20
- Lot 6 Sperry Ln
- 200 Smith St
- 165 Chestnut St
- 157 Fisher St
- 130 E Washington St Unit 71
- 35-R Whiting St
- 31 Whiting St
- 36 Jefferson St
- 212 Fisher St Unit A13
- 47 Sumner St
- 47 Sumner St Unit 3
- 47 Sumner St Unit 2
- 43 Sumner St
- 53 Sumner St
- 39 Sumner St
- 57 Arnold Rd
- 27 Arnold Rd
- 27 Arnold Rd
- 27 Arnold Rd Unit 3
- 36 Sumner St
- 38 Arnold Rd
- 38 Arnold Rd Unit Apartment3
- 38 Arnold Rd
- 38 Arnold Rd Unit Apartment1
- 42 Arnold Rd
- 29 Sumner St
- 9 Taylor St
- 32 Arnold Rd
- 19 Taylor St
Your Personal Tour Guide
Ask me questions while you tour the home.