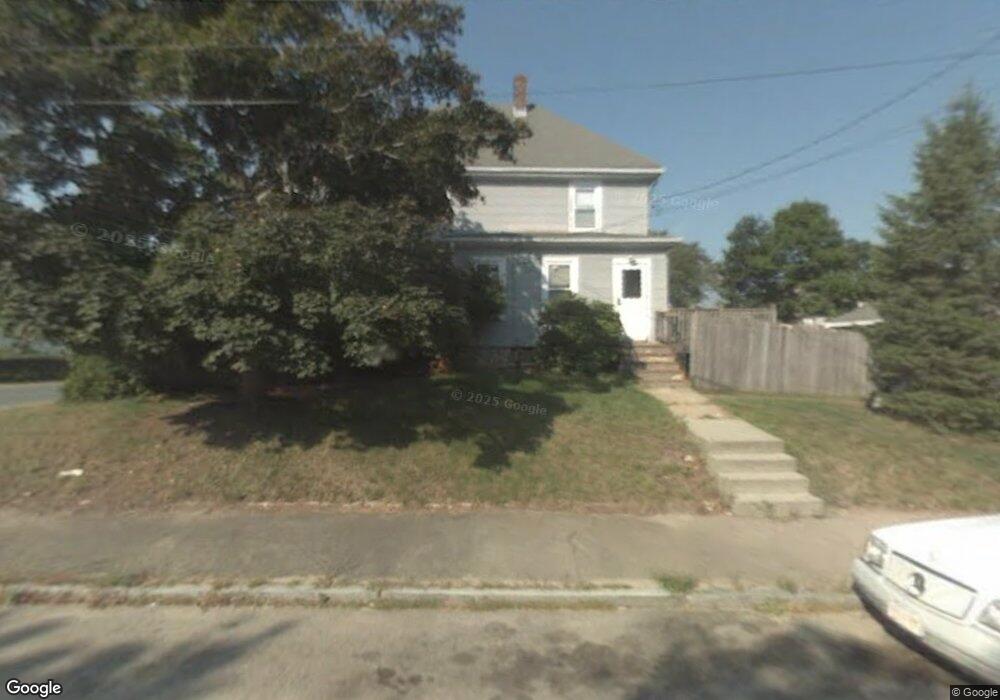
47 Sycamore St Brockton, MA 02301
Estimated Value: $512,330 - $533,000
3
Beds
1
Bath
1,647
Sq Ft
$317/Sq Ft
Est. Value
About This Home
This home is located at 47 Sycamore St, Brockton, MA 02301 and is currently estimated at $522,083, approximately $316 per square foot. 47 Sycamore St is a home located in Plymouth County with nearby schools including Louis F Angelo Elementary School, Raymond K-8 Elementary School, and Hancock Elementary School.
Ownership History
Date
Name
Owned For
Owner Type
Purchase Details
Closed on
Dec 10, 2001
Sold by
Barham Ronald A and Barham Tabitha H
Bought by
Jean-Baptiste F M
Current Estimated Value
Home Financials for this Owner
Home Financials are based on the most recent Mortgage that was taken out on this home.
Original Mortgage
$174,300
Interest Rate
6.67%
Mortgage Type
Purchase Money Mortgage
Purchase Details
Closed on
May 28, 1999
Sold by
Austin Robert F
Bought by
Barham Ronald A and Barham Tabitha H
Create a Home Valuation Report for This Property
The Home Valuation Report is an in-depth analysis detailing your home's value as well as a comparison with similar homes in the area
Home Values in the Area
Average Home Value in this Area
Purchase History
| Date | Buyer | Sale Price | Title Company |
|---|---|---|---|
| Jean-Baptiste F M | $183,500 | -- | |
| Barham Ronald A | $129,000 | -- |
Source: Public Records
Mortgage History
| Date | Status | Borrower | Loan Amount |
|---|---|---|---|
| Open | Barham Ronald A | $174,300 | |
| Closed | Barham Ronald A | $174,300 |
Source: Public Records
Tax History Compared to Growth
Tax History
| Year | Tax Paid | Tax Assessment Tax Assessment Total Assessment is a certain percentage of the fair market value that is determined by local assessors to be the total taxable value of land and additions on the property. | Land | Improvement |
|---|---|---|---|---|
| 2025 | $5,119 | $422,700 | $143,700 | $279,000 |
| 2024 | $4,771 | $396,900 | $143,700 | $253,200 |
| 2023 | $4,897 | $377,300 | $108,300 | $269,000 |
| 2022 | $4,645 | $332,500 | $98,300 | $234,200 |
| 2021 | $4,363 | $300,900 | $90,000 | $210,900 |
| 2020 | $4,407 | $290,900 | $86,600 | $204,300 |
| 2019 | $4,214 | $271,200 | $79,700 | $191,500 |
| 2018 | $3,895 | $242,500 | $79,700 | $162,800 |
| 2017 | $3,523 | $218,800 | $79,700 | $139,100 |
| 2016 | $3,802 | $219,000 | $75,900 | $143,100 |
| 2015 | $2,995 | $165,000 | $75,900 | $89,100 |
| 2014 | $2,875 | $158,600 | $75,900 | $82,700 |
Source: Public Records
Map
Nearby Homes
- 49 Sycamore St
- 113 Wheeler Ave
- 55 Sycamore St
- 55 Sycamore St Unit 1
- 122 Wheeler Ave
- 114 Wheeler Ave
- 107 Wheeler Ave
- 2 Rochelle St
- 50 Sycamore St
- 40 Sycamore St
- 110 Wheeler Ave
- 61 Sycamore St
- 23 Sycamore St
- 34 Sycamore St
- 54 Sycamore St
- 148 Park Rd
- 126 Park Rd
- 107 Malvern Rd
- 30 Sycamore St
- 105 Malvern Rd