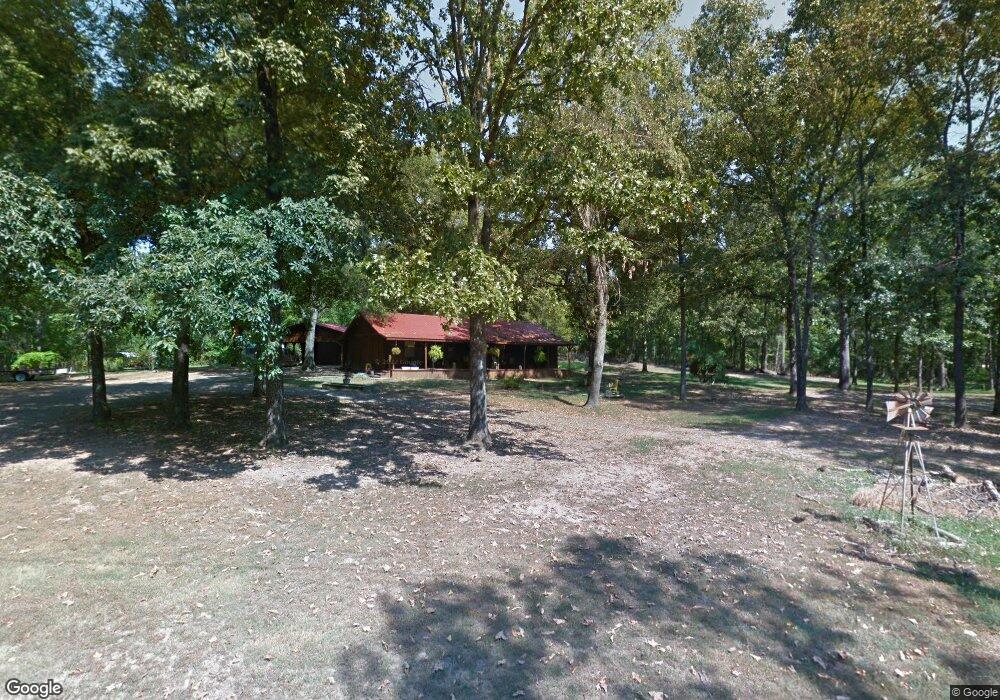
47 Tahnee Ln Broken Bow, OK 74728
Estimated Value: $380,000 - $454,762
2
Beds
2
Baths
1,248
Sq Ft
$323/Sq Ft
Est. Value
About This Home
This home is located at 47 Tahnee Ln, Broken Bow, OK 74728 and is currently estimated at $402,941, approximately $322 per square foot. 47 Tahnee Ln is a home located in McCurtain County with nearby schools including Dierks Elementary School, Bennett Elementary School, and Rector Johnson Middle School.
Ownership History
Date
Name
Owned For
Owner Type
Purchase Details
Closed on
Oct 29, 2024
Sold by
Banner Thomas A and Banner Terri
Bought by
Fath Jeffrey
Current Estimated Value
Home Financials for this Owner
Home Financials are based on the most recent Mortgage that was taken out on this home.
Original Mortgage
$324,000
Outstanding Balance
$319,751
Interest Rate
6.09%
Mortgage Type
New Conventional
Estimated Equity
$83,190
Purchase Details
Closed on
Nov 16, 2017
Sold by
Providence Get Away Lllp
Bought by
Banner Thomas A and Banner Terri
Home Financials for this Owner
Home Financials are based on the most recent Mortgage that was taken out on this home.
Original Mortgage
$243,000
Interest Rate
3.85%
Mortgage Type
New Conventional
Purchase Details
Closed on
Jun 25, 1999
Sold by
Dollarhide Billy
Bought by
Mullis Marshall and Mullis Lou
Create a Home Valuation Report for This Property
The Home Valuation Report is an in-depth analysis detailing your home's value as well as a comparison with similar homes in the area
Home Values in the Area
Average Home Value in this Area
Purchase History
| Date | Buyer | Sale Price | Title Company |
|---|---|---|---|
| Fath Jeffrey | $360,000 | Alliant National Title Insuran | |
| Banner Thomas A | $270,000 | None Available | |
| Mullis Marshall | $18,000 | -- |
Source: Public Records
Mortgage History
| Date | Status | Borrower | Loan Amount |
|---|---|---|---|
| Open | Fath Jeffrey | $324,000 | |
| Previous Owner | Banner Thomas A | $243,000 |
Source: Public Records
Tax History
| Year | Tax Paid | Tax Assessment Tax Assessment Total Assessment is a certain percentage of the fair market value that is determined by local assessors to be the total taxable value of land and additions on the property. | Land | Improvement |
|---|---|---|---|---|
| 2025 | $3,302 | $39,600 | $5,069 | $34,531 |
| 2024 | $1,307 | $15,680 | $1,980 | $13,700 |
| 2023 | $1,285 | $15,680 | $1,980 | $13,700 |
| 2022 | $1,286 | $15,680 | $1,980 | $13,700 |
| 2021 | $1,264 | $15,680 | $1,980 | $13,700 |
| 2020 | $1,301 | $16,011 | $1,980 | $14,031 |
| 2019 | $2,425 | $29,700 | $1,980 | $27,720 |
| 2018 | $2,452 | $29,700 | $1,980 | $27,720 |
| 2017 | $485 | $6,833 | $1,311 | $5,522 |
| 2016 | $389 | $6,633 | $1,980 | $4,653 |
| 2015 | $398 | $6,633 | $1,980 | $4,653 |
| 2014 | $400 | $6,633 | $1,980 | $4,653 |
Source: Public Records
Map
Nearby Homes
Your Personal Tour Guide
Ask me questions while you tour the home.