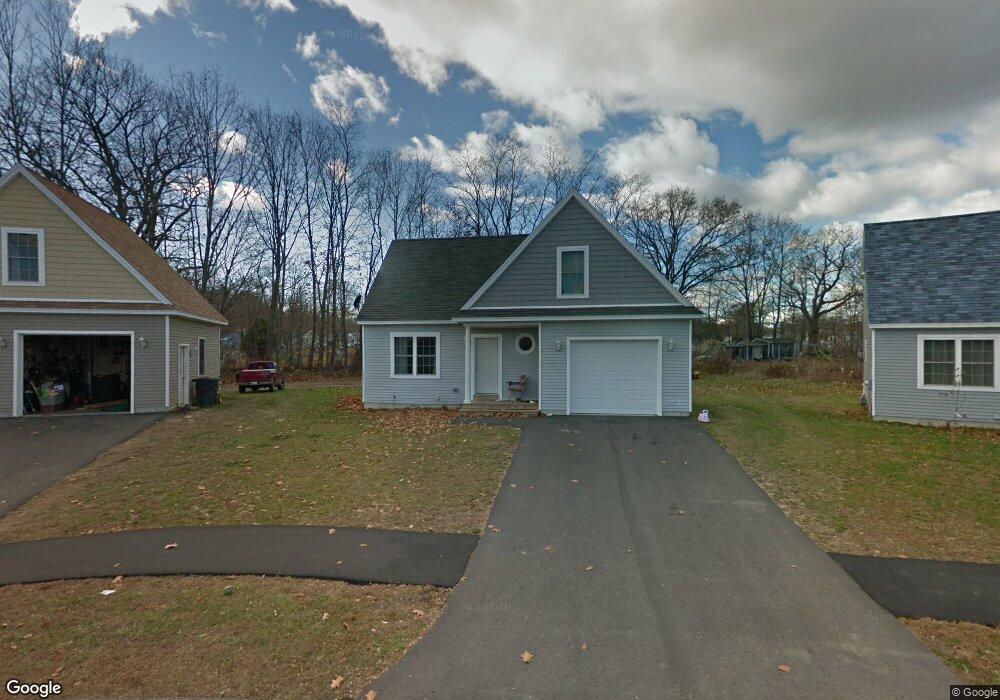
47 Tink Dr Gorham, ME 04038
Estimated Value: $435,000 - $490,000
3
Beds
2
Baths
1,240
Sq Ft
$368/Sq Ft
Est. Value
About This Home
This home is located at 47 Tink Dr, Gorham, ME 04038 and is currently estimated at $456,695, approximately $368 per square foot. 47 Tink Dr is a home located in Cumberland County with nearby schools including Narragansett Elementary School, Gorham Middle School, and Gorham High School.
Ownership History
Date
Name
Owned For
Owner Type
Purchase Details
Closed on
Jan 15, 2025
Sold by
Krouse John A and Krouse Kristie L
Bought by
Mayifuila Mpanzu and Kaza Mpasi
Current Estimated Value
Home Financials for this Owner
Home Financials are based on the most recent Mortgage that was taken out on this home.
Original Mortgage
$422,211
Outstanding Balance
$419,210
Interest Rate
6.69%
Mortgage Type
FHA
Estimated Equity
$37,485
Purchase Details
Closed on
May 5, 2020
Sold by
Celedonio-Chinchilla C
Bought by
Krouse John A and Krouse Kristie L
Home Financials for this Owner
Home Financials are based on the most recent Mortgage that was taken out on this home.
Original Mortgage
$155,000
Interest Rate
3.5%
Mortgage Type
New Conventional
Purchase Details
Closed on
Jul 22, 2014
Sold by
Susan Duchaine Llc
Bought by
Chinchilla-Carrera C
Home Financials for this Owner
Home Financials are based on the most recent Mortgage that was taken out on this home.
Original Mortgage
$209,081
Interest Rate
4.14%
Mortgage Type
Unknown
Create a Home Valuation Report for This Property
The Home Valuation Report is an in-depth analysis detailing your home's value as well as a comparison with similar homes in the area
Home Values in the Area
Average Home Value in this Area
Purchase History
| Date | Buyer | Sale Price | Title Company |
|---|---|---|---|
| Mayifuila Mpanzu | $430,000 | None Available | |
| Mayifuila Mpanzu | $430,000 | None Available | |
| Krouse John A | -- | None Available | |
| Krouse John A | -- | None Available | |
| Chinchilla-Carrera C | -- | -- | |
| Chinchilla-Carrera C | -- | -- |
Source: Public Records
Mortgage History
| Date | Status | Borrower | Loan Amount |
|---|---|---|---|
| Open | Mayifuila Mpanzu | $422,211 | |
| Closed | Mayifuila Mpanzu | $422,211 | |
| Previous Owner | Krouse John A | $155,000 | |
| Previous Owner | Chinchilla-Carrera C | $209,081 |
Source: Public Records
Tax History Compared to Growth
Tax History
| Year | Tax Paid | Tax Assessment Tax Assessment Total Assessment is a certain percentage of the fair market value that is determined by local assessors to be the total taxable value of land and additions on the property. | Land | Improvement |
|---|---|---|---|---|
| 2024 | $4,744 | $322,700 | $32,700 | $290,000 |
| 2023 | $4,437 | $322,700 | $32,700 | $290,000 |
| 2022 | $4,147 | $322,700 | $32,700 | $290,000 |
| 2021 | $3,558 | $183,400 | $113,600 | $69,800 |
| 2020 | $3,485 | $183,400 | $113,600 | $69,800 |
| 2019 | $3,475 | $183,400 | $113,600 | $69,800 |
| 2018 | $3,338 | $183,400 | $113,600 | $69,800 |
| 2017 | $3,136 | $183,400 | $113,600 | $69,800 |
| 2016 | $3,120 | $183,500 | $113,700 | $69,800 |
| 2015 | $2,991 | $183,500 | $113,700 | $69,800 |
| 2014 | $1,406 | $80,800 | $80,800 | $0 |
| 2013 | $1,398 | $80,800 | $80,800 | $0 |
Source: Public Records
Map
Nearby Homes
- 33 Tink Dr
- 40 Tink Dr
- TBD Lochwood Dr
- 49 Lochwood Dr
- 53 Lochwood Dr
- 84 Johnson Rd
- 14 Joseph Dr
- 23 Cottage Ct
- 23 Cottage Ct Unit 6
- 8 Stephen Ward Dr Unit 14
- 40 Highland Ave
- 34 Baxter Ln Unit 10
- 9 Ridgeway Ave
- 8 College Ave
- 151 South St
- 117 School St
- 69 State St
- 197 New Portland Rd
- 21 Lombard St
- 127 Falcon Crest Dr Unit 4
- 47 Tink Dr
- 47 Tink Dr Unit 21
- 45 Tink Dr Unit 45
- 45 Tink Dr Unit 22
- 49 Tink Dr Unit 20
- 43 Tink Dr Unit 23
- 43 Tink Dr
- 51 Tink Dr
- 41 Tink Dr Unit 24
- 41 Tink Dr
- 52 Tink Dr Unit 19
- 50 Tink Dr Unit 18
- Unit #32 Tink Dr Unit 32
- 29 Tink Dr Unit 26
- 29 Tink Dr
- 48 Tink Dr Unit 17
- 44 Tink Dr
- 44 Tink Dr Unit 15
- 40 Tink Dr Unit 14
- 46 Tink Dr Unit 16