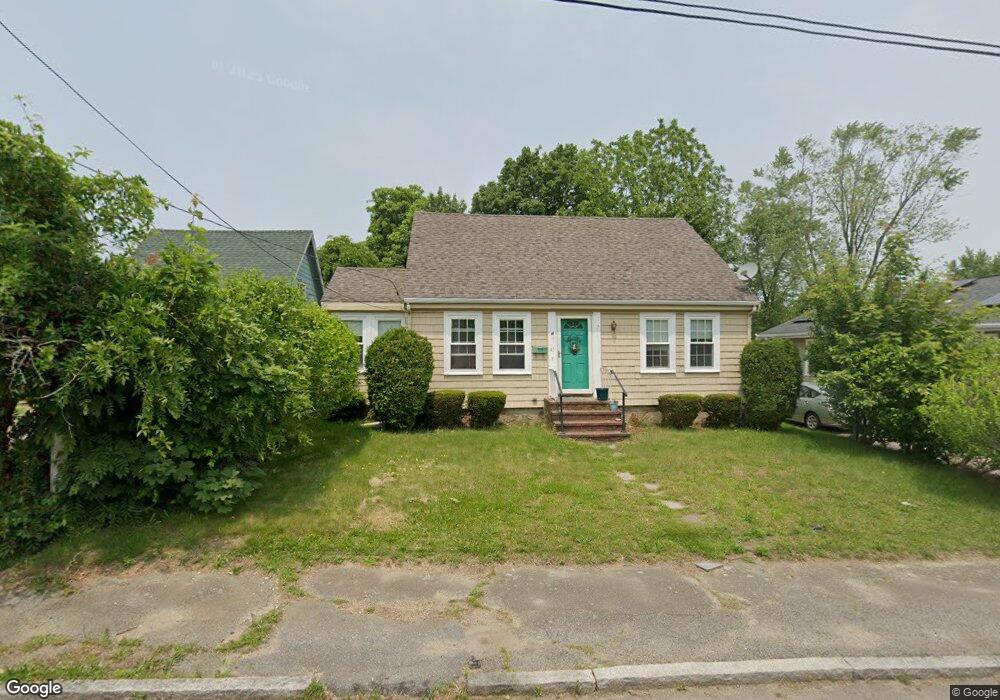
47 Vesey St Brockton, MA 02301
Clifton Heights NeighborhoodEstimated Value: $434,000 - $490,289
3
Beds
3
Baths
1,421
Sq Ft
$330/Sq Ft
Est. Value
About This Home
This home is located at 47 Vesey St, Brockton, MA 02301 and is currently estimated at $468,572, approximately $329 per square foot. 47 Vesey St is a home located in Plymouth County with nearby schools including John F. Kennedy Elementary School, Davis K-8 School, and South Middle School.
Ownership History
Date
Name
Owned For
Owner Type
Purchase Details
Closed on
Aug 31, 1994
Sold by
Financial Enterprises
Bought by
Stewart Kevin C and Stewart Diane M
Current Estimated Value
Purchase Details
Closed on
May 12, 1994
Sold by
Leonard Robert F and Leonard Jacqueline C
Bought by
Financial Enterprises
Create a Home Valuation Report for This Property
The Home Valuation Report is an in-depth analysis detailing your home's value as well as a comparison with similar homes in the area
Home Values in the Area
Average Home Value in this Area
Purchase History
| Date | Buyer | Sale Price | Title Company |
|---|---|---|---|
| Stewart Kevin C | $87,000 | -- | |
| Financial Enterprises | $54,000 | -- |
Source: Public Records
Mortgage History
| Date | Status | Borrower | Loan Amount |
|---|---|---|---|
| Open | Financial Enterprises | $140,000 | |
| Closed | Financial Enterprises | $108,103 | |
| Closed | Financial Enterprises | $20,000 |
Source: Public Records
Tax History Compared to Growth
Tax History
| Year | Tax Paid | Tax Assessment Tax Assessment Total Assessment is a certain percentage of the fair market value that is determined by local assessors to be the total taxable value of land and additions on the property. | Land | Improvement |
|---|---|---|---|---|
| 2025 | $4,596 | $379,500 | $140,100 | $239,400 |
| 2024 | $4,548 | $378,400 | $140,100 | $238,300 |
| 2023 | $4,440 | $342,100 | $104,500 | $237,600 |
| 2022 | $4,250 | $304,200 | $95,000 | $209,200 |
| 2021 | $4,315 | $297,600 | $78,900 | $218,700 |
| 2020 | $4,039 | $266,600 | $73,900 | $192,700 |
| 2019 | $3,790 | $243,900 | $72,100 | $171,800 |
| 2018 | $3,246 | $202,100 | $72,100 | $130,000 |
| 2017 | $3,053 | $189,600 | $72,100 | $117,500 |
| 2016 | $2,967 | $170,900 | $69,900 | $101,000 |
| 2015 | $2,628 | $144,800 | $69,900 | $74,900 |
| 2014 | $2,721 | $150,100 | $69,900 | $80,200 |
Source: Public Records
Map
Nearby Homes