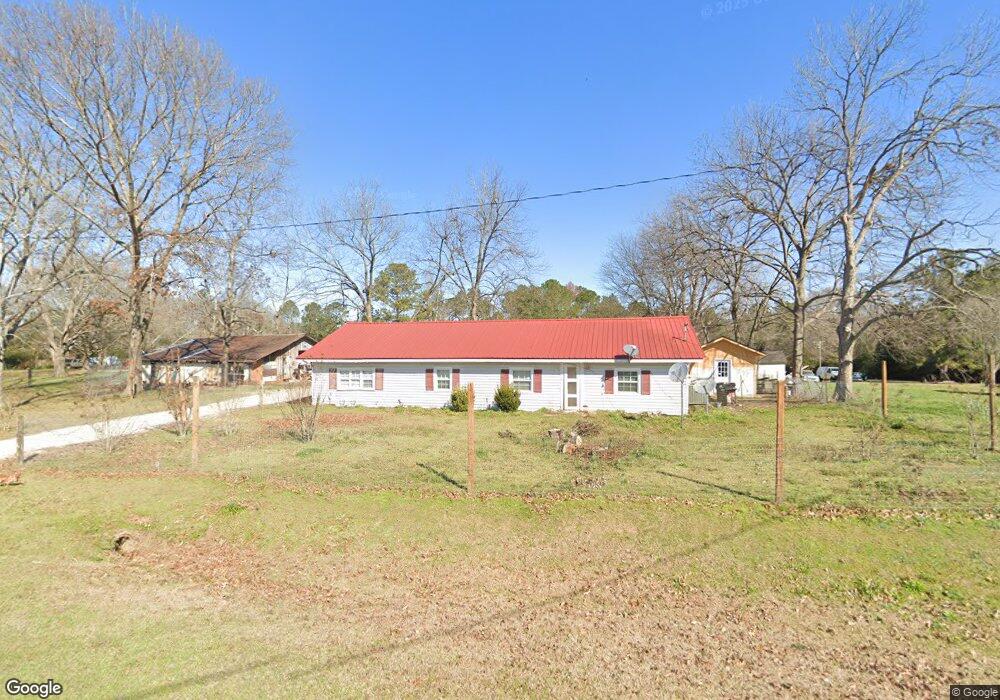
470 Arch Helms Rd Americus, GA 31719
Estimated Value: $96,000 - $149,000
3
Beds
1
Bath
1,512
Sq Ft
$77/Sq Ft
Est. Value
About This Home
This home is located at 470 Arch Helms Rd, Americus, GA 31719 and is currently estimated at $116,656, approximately $77 per square foot. 470 Arch Helms Rd is a home located in Sumter County with nearby schools including Sumter County Primary School, Sumter County Elementary School, and Sumter County Middle School.
Ownership History
Date
Name
Owned For
Owner Type
Purchase Details
Closed on
Jul 27, 2016
Bought by
Soto Marcelino
Current Estimated Value
Home Financials for this Owner
Home Financials are based on the most recent Mortgage that was taken out on this home.
Original Mortgage
$33,875
Outstanding Balance
$9,576
Interest Rate
3.48%
Mortgage Type
New Conventional
Estimated Equity
$107,080
Purchase Details
Closed on
Feb 2, 2016
Sold by
Jackson Sherlanda F
Bought by
Jpmorgan Chase Bank National A
Purchase Details
Closed on
Jun 5, 2008
Sold by
Allen Bruce
Bought by
Jackson Sherlanda F
Home Financials for this Owner
Home Financials are based on the most recent Mortgage that was taken out on this home.
Original Mortgage
$63,130
Interest Rate
6.04%
Mortgage Type
New Conventional
Purchase Details
Closed on
Jul 3, 1990
Bought by
Allen Bruce O
Create a Home Valuation Report for This Property
The Home Valuation Report is an in-depth analysis detailing your home's value as well as a comparison with similar homes in the area
Home Values in the Area
Average Home Value in this Area
Purchase History
| Date | Buyer | Sale Price | Title Company |
|---|---|---|---|
| Soto Marcelino | $32,760 | -- | |
| Jpmorgan Chase Bank National A | -- | -- | |
| Jackson Sherlanda F | $60,150 | -- | |
| Allen Bruce O | $27,000 | -- |
Source: Public Records
Mortgage History
| Date | Status | Borrower | Loan Amount |
|---|---|---|---|
| Open | Soto Marcelino | $33,875 | |
| Previous Owner | Jackson Sherlanda F | $63,130 |
Source: Public Records
Tax History Compared to Growth
Tax History
| Year | Tax Paid | Tax Assessment Tax Assessment Total Assessment is a certain percentage of the fair market value that is determined by local assessors to be the total taxable value of land and additions on the property. | Land | Improvement |
|---|---|---|---|---|
| 2024 | $1,338 | $27,972 | $4,160 | $23,812 |
| 2023 | $1,310 | $27,972 | $4,160 | $23,812 |
| 2022 | $1,310 | $27,972 | $4,160 | $23,812 |
| 2021 | $1,312 | $27,972 | $4,160 | $23,812 |
| 2020 | $1,342 | $27,972 | $4,160 | $23,812 |
| 2019 | $1,270 | $27,972 | $4,160 | $23,812 |
| 2018 | $1,270 | $27,972 | $4,160 | $23,812 |
| 2017 | $802 | $27,972 | $4,160 | $23,812 |
| 2016 | $1,271 | $27,972 | $4,160 | $23,812 |
| 2015 | $1,279 | $28,840 | $4,160 | $24,680 |
| 2014 | $1,280 | $28,840 | $4,160 | $24,680 |
| 2013 | -- | $28,840 | $4,160 | $24,680 |
Source: Public Records
Map
Nearby Homes
- 148 Harper Subdivision
- 378 Ga Highway 308
- 104 Westlake Cir
- 720 Wise Rd
- Lot 38 Wolf Creek Dr
- TBD Wolf Creek Dr
- 207 Wolf Creek Dr
- TBD Valley Dr
- TBD New Bending Rd
- Lot 73 & 74 Wolf Creek Dr
- 205 Valley Dr
- 100 Odum Rd
- 633 S Hampton St
- 136 Loop Rd
- 115 Lake Jennifer Dr
- 121 S Forty Cir
- 0 Beale St
- 205 U S 19
- 000 U S Highway 19
- Lot 5 Lake Jennifer Dr
- 473 Arch Helms Rd
- 476 Arch Helms Rd
- 479 Arch Helms Rd
- 460 Arch Helms Rd
- 482 Arch Helms Rd
- 494 Arch Helms Rd
- 451 Arch Helms Rd
- 456 Arch Helms Rd
- 499 Arch Helms Rd
- 438 Arch Helms Rd
- 485 Arch Helms Rd
- 491 Arch Elms Rd
- 516 Arch Helms Rd
- 417 Arch Helms Rd
- 408 Arch Helms Rd
- 411 Arch Helms Rd
- 525 Arch Helms Rd
- 429-21 Arch Helms Rd
- 429 Arch Helms Rd
- 984 Ga Highway 49 S