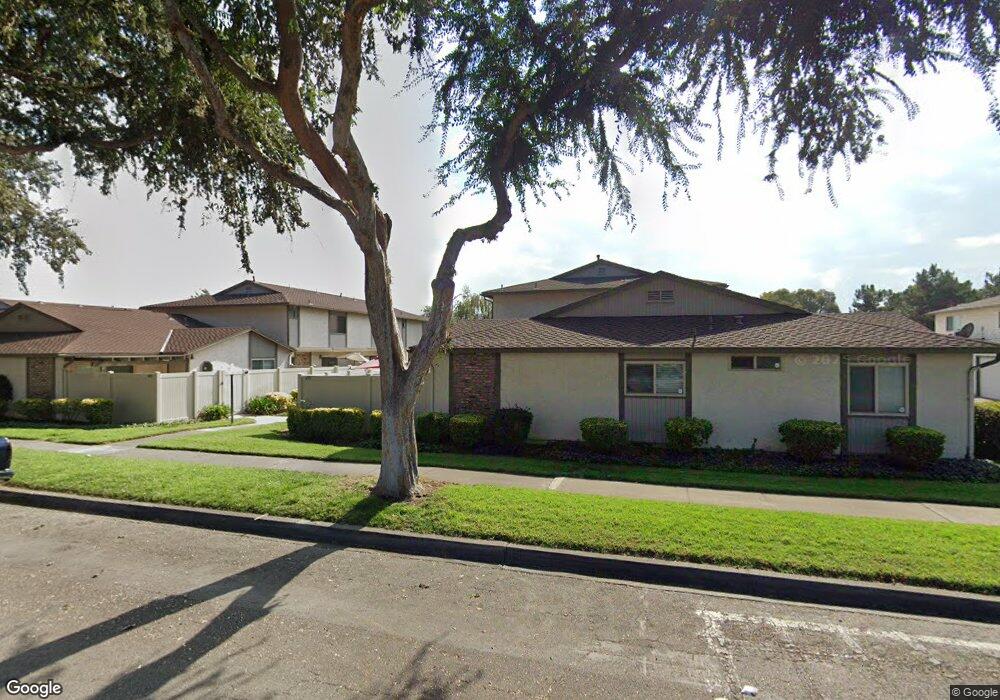
470 D St Unit 21 Upland, CA 91786
Estimated Value: $458,373 - $488,000
2
Beds
2
Baths
1,155
Sq Ft
$408/Sq Ft
Est. Value
About This Home
This home is located at 470 D St Unit 21, Upland, CA 91786 and is currently estimated at $470,843, approximately $407 per square foot. 470 D St Unit 21 is a home located in San Bernardino County with nearby schools including Upland Elementary School, Upland Junior High School, and Upland High School.
Ownership History
Date
Name
Owned For
Owner Type
Purchase Details
Closed on
Feb 26, 2007
Sold by
Bias Yvonne Ruth and Bias Yvonne
Bought by
Bias Yvonne Ruth and The Bias Family Trust
Current Estimated Value
Purchase Details
Closed on
Aug 24, 2001
Sold by
Daniel Fred W
Bought by
Bias Yvonne
Home Financials for this Owner
Home Financials are based on the most recent Mortgage that was taken out on this home.
Original Mortgage
$88,400
Outstanding Balance
$34,109
Interest Rate
7%
Estimated Equity
$436,734
Create a Home Valuation Report for This Property
The Home Valuation Report is an in-depth analysis detailing your home's value as well as a comparison with similar homes in the area
Home Values in the Area
Average Home Value in this Area
Purchase History
| Date | Buyer | Sale Price | Title Company |
|---|---|---|---|
| Bias Yvonne Ruth | -- | None Available | |
| Bias Yvonne | $122,000 | Fidelity National Title Ins |
Source: Public Records
Mortgage History
| Date | Status | Borrower | Loan Amount |
|---|---|---|---|
| Open | Bias Yvonne | $88,400 |
Source: Public Records
Tax History
| Year | Tax Paid | Tax Assessment Tax Assessment Total Assessment is a certain percentage of the fair market value that is determined by local assessors to be the total taxable value of land and additions on the property. | Land | Improvement |
|---|---|---|---|---|
| 2025 | $2,059 | $180,232 | $63,082 | $117,150 |
| 2024 | $1,993 | $176,698 | $61,845 | $114,853 |
| 2023 | $1,960 | $173,233 | $60,632 | $112,601 |
| 2022 | $1,915 | $169,836 | $59,443 | $110,393 |
| 2021 | $1,908 | $166,505 | $58,277 | $108,228 |
| 2020 | $1,856 | $164,797 | $57,679 | $107,118 |
| 2019 | $1,849 | $161,566 | $56,548 | $105,018 |
| 2018 | $1,805 | $158,398 | $55,439 | $102,959 |
| 2017 | $1,752 | $155,292 | $54,352 | $100,940 |
| 2016 | $1,576 | $152,247 | $53,286 | $98,961 |
| 2015 | $1,539 | $149,961 | $52,486 | $97,475 |
| 2014 | $1,498 | $147,024 | $51,458 | $95,566 |
Source: Public Records
Map
Nearby Homes
Your Personal Tour Guide
Ask me questions while you tour the home.