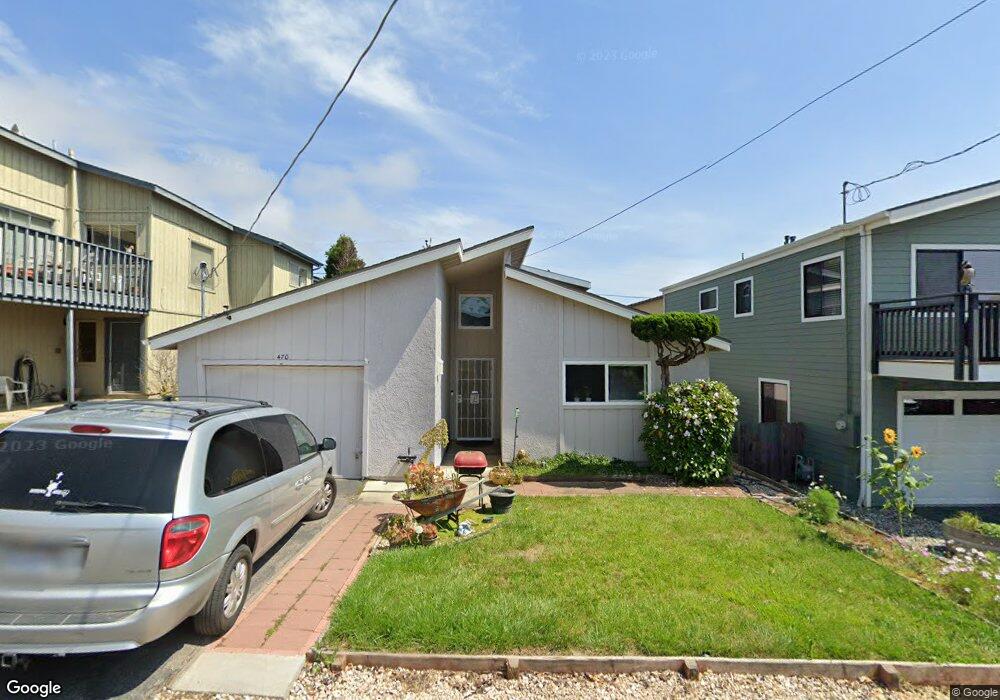
470 Java St Morro Bay, CA 93442
Estimated Value: $671,674 - $764,000
2
Beds
2
Baths
990
Sq Ft
$727/Sq Ft
Est. Value
About This Home
This home is located at 470 Java St, Morro Bay, CA 93442 and is currently estimated at $720,169, approximately $727 per square foot. 470 Java St is a home located in San Luis Obispo County with nearby schools including Del Mar Elementary School, Los Osos Middle School, and Morro Bay High School.
Ownership History
Date
Name
Owned For
Owner Type
Purchase Details
Closed on
Aug 22, 2019
Sold by
Graves Todd
Bought by
Graves Todd and Todd Graves Separate Property
Current Estimated Value
Purchase Details
Closed on
Jan 5, 2019
Sold by
Graves Trent
Bought by
Graves Todd
Purchase Details
Closed on
Aug 10, 2018
Sold by
Graves Louvina and Trent Graves Irrevocable Trust
Bought by
Graves Trent
Purchase Details
Closed on
Mar 21, 2018
Sold by
Graves George W and Graves Louvina M
Bought by
Graves Todd and Graves Trent
Purchase Details
Closed on
Feb 10, 1995
Sold by
Graves George W and Graves Louvina M
Bought by
Graves George W and Graves Louvina M
Create a Home Valuation Report for This Property
The Home Valuation Report is an in-depth analysis detailing your home's value as well as a comparison with similar homes in the area
Home Values in the Area
Average Home Value in this Area
Purchase History
| Date | Buyer | Sale Price | Title Company |
|---|---|---|---|
| Graves Todd | -- | None Available | |
| Graves Todd | -- | None Available | |
| Graves Trent | -- | None Available | |
| Graves Todd | -- | None Available | |
| Graves Todd | -- | None Available | |
| Graves George W | -- | -- |
Source: Public Records
Tax History
| Year | Tax Paid | Tax Assessment Tax Assessment Total Assessment is a certain percentage of the fair market value that is determined by local assessors to be the total taxable value of land and additions on the property. | Land | Improvement |
|---|---|---|---|---|
| 2025 | $3,993 | $368,579 | $221,827 | $146,752 |
| 2024 | $3,921 | $361,353 | $217,478 | $143,875 |
| 2023 | $3,921 | $354,268 | $213,214 | $141,054 |
| 2022 | $3,676 | $347,323 | $209,034 | $138,289 |
| 2021 | $3,617 | $340,514 | $204,936 | $135,578 |
| 2020 | $3,580 | $337,023 | $202,835 | $134,188 |
| 2019 | $1,491 | $139,034 | $47,718 | $91,316 |
| 2018 | $1,462 | $136,309 | $46,783 | $89,526 |
| 2017 | $1,433 | $133,637 | $45,866 | $87,771 |
| 2016 | $1,405 | $131,017 | $44,967 | $86,050 |
| 2015 | $1,383 | $129,050 | $44,292 | $84,758 |
| 2014 | $1,270 | $126,523 | $43,425 | $83,098 |
Source: Public Records
Map
Nearby Homes
- 440 Luzon St
- 410 Island St
- 390 Nassau St
- 351 Nevis St
- 3020 Ironwood Ave
- 440 Panay St
- 390 Panay St
- 670 Sequoia Ct
- 650 Sequoia Ct
- 3329 Panorama Dr
- 474 Whidbey Way
- 2900 Alder Ave
- 530 Zanzibar St
- 2783 Coral Ave
- 2785 Hemlock Ave
- 679 Elena St
- 2600 Ironwood Ave
- 2581 Juniper Ave
- 2560 Juniper Ave
- 2350 Nutmeg Ave
Your Personal Tour Guide
Ask me questions while you tour the home.