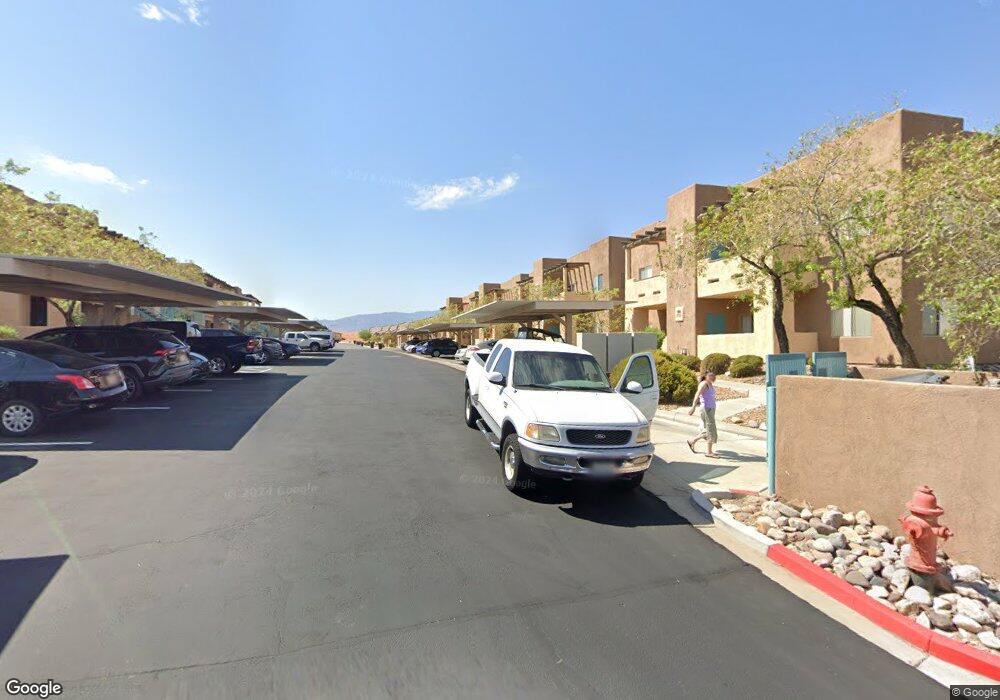
470 Turtle Back Rd Unit 9B Mesquite, NV 89027
Estimated Value: $210,000 - $219,000
2
Beds
2
Baths
1,288
Sq Ft
$168/Sq Ft
Est. Value
About This Home
This home is located at 470 Turtle Back Rd Unit 9B, Mesquite, NV 89027 and is currently estimated at $216,280, approximately $167 per square foot. 470 Turtle Back Rd Unit 9B is a home located in Clark County with nearby schools including Virgin Valley Elementary School, Charles Arthur Hughes Middle School, and Virgin Valley High School.
Ownership History
Date
Name
Owned For
Owner Type
Purchase Details
Closed on
Apr 22, 2024
Sold by
Nicoll Penny
Bought by
Koer Julianne Louise and Koer David Bruce
Current Estimated Value
Purchase Details
Closed on
May 21, 2018
Sold by
Oliver George T and Oliver Donna M
Bought by
Derr Susan K
Purchase Details
Closed on
Apr 18, 2012
Sold by
Farmers Insurance Group Federal Credit U
Bought by
Oliver George T and Oliver Donna M
Purchase Details
Closed on
Oct 9, 2009
Sold by
Montague Edward
Bought by
Farmers Insurance Group Federal Credit U
Purchase Details
Closed on
Jun 5, 2006
Sold by
Red Vistas Llc
Bought by
Montague Edward G
Home Financials for this Owner
Home Financials are based on the most recent Mortgage that was taken out on this home.
Original Mortgage
$160,000
Interest Rate
6.13%
Mortgage Type
Unknown
Create a Home Valuation Report for This Property
The Home Valuation Report is an in-depth analysis detailing your home's value as well as a comparison with similar homes in the area
Purchase History
| Date | Buyer | Sale Price | Title Company |
|---|---|---|---|
| Koer Julianne Louise | $230,000 | Driggs Title | |
| Derr Susan K | $115,000 | Fidelity National Title M | |
| Oliver George T | $50,000 | Fidelity Title Mesquite | |
| Farmers Insurance Group Federal Credit U | $80,000 | None Available | |
| Montague Edward G | $160,000 | Fidelity National Title |
Source: Public Records
Mortgage History
| Date | Status | Borrower | Loan Amount |
|---|---|---|---|
| Previous Owner | Montague Edward G | $160,000 |
Source: Public Records
Tax History
| Year | Tax Paid | Tax Assessment Tax Assessment Total Assessment is a certain percentage of the fair market value that is determined by local assessors to be the total taxable value of land and additions on the property. | Land | Improvement |
|---|---|---|---|---|
| 2026 | $880 | $59,998 | $15,750 | $44,248 |
| 2025 | $855 | $60,664 | $16,450 | $44,214 |
| 2024 | $831 | $60,664 | $16,450 | $44,214 |
| 2023 | $831 | $60,129 | $19,600 | $40,529 |
| 2022 | $769 | $53,811 | $16,450 | $37,361 |
| 2021 | $712 | $46,236 | $11,200 | $35,036 |
| 2020 | $660 | $44,153 | $11,200 | $32,953 |
| 2019 | $618 | $38,900 | $11,200 | $27,700 |
| 2018 | $590 | $33,932 | $6,300 | $27,632 |
| 2017 | $849 | $30,591 | $5,950 | $24,641 |
| 2016 | $552 | $25,342 | $4,200 | $21,142 |
| 2015 | $551 | $19,240 | $3,500 | $15,740 |
| 2014 | $534 | $18,721 | $5,250 | $13,471 |
Source: Public Records
Map
Nearby Homes
- 465 Turtleback Rd Unit B
- 518 Turtleback Rd Unit C
- 498 Canyon View Way
- 378 Colleen Ct Unit C
- 529 Canyon Way
- 260 Haley Way Unit 157
- 555 Highland Dr Unit 330
- 430 Chalet Dr
- 563 Fairways Dr
- 744 Pinnacle Ct
- 870 Ironwood Dr
- 241 Palmer Ln
- 121 Hermosa Way
- 228 Hiawatha Way
- 997 Jade St
- 686 Mayan Cir
- 401 Honeysuckle Ln
- 601 Hillside Dr
- 238 Thistle St
- 262 Thistle St
- 470 Turtle Back Rd Unit 724
- 470 Turtle Back Rd Unit 4A
- 470 Turtle Back Rd Unit 7B
- 470 Turtle Back Rd Unit 11A
- 470 Turtle Back Rd Unit 5D
- 470 Turtle Back Rd Unit 5B
- 470 Turtle Back Rd Unit 5A
- 470 Turtle Back Rd Unit 7C
- 470 Turtle Back Rd Unit 9A
- 470 Turtle Back Rd Unit 8D
- 470 Turtle Back Rd Unit 10A
- 470 Turtle Back Rd Unit 11C
- 470 Turtle Back Rd Unit 7D
- 470 Turtle Back Rd Unit 3B
- 470 Turtle Back Rd Unit 11B
- 470 Turtle Back Rd Unit 10C
- 470 Turtle Back Rd Unit 10B
- 470 Turtle Back Rd Unit 8A
- 470 Turtle Back Rd Unit 8C
- 470 Turtle Back Rd Unit 8B
Your Personal Tour Guide
Ask me questions while you tour the home.