Estimated Value: $396,000 - $503,000
2
Beds
3
Baths
2,176
Sq Ft
$211/Sq Ft
Est. Value
About This Home
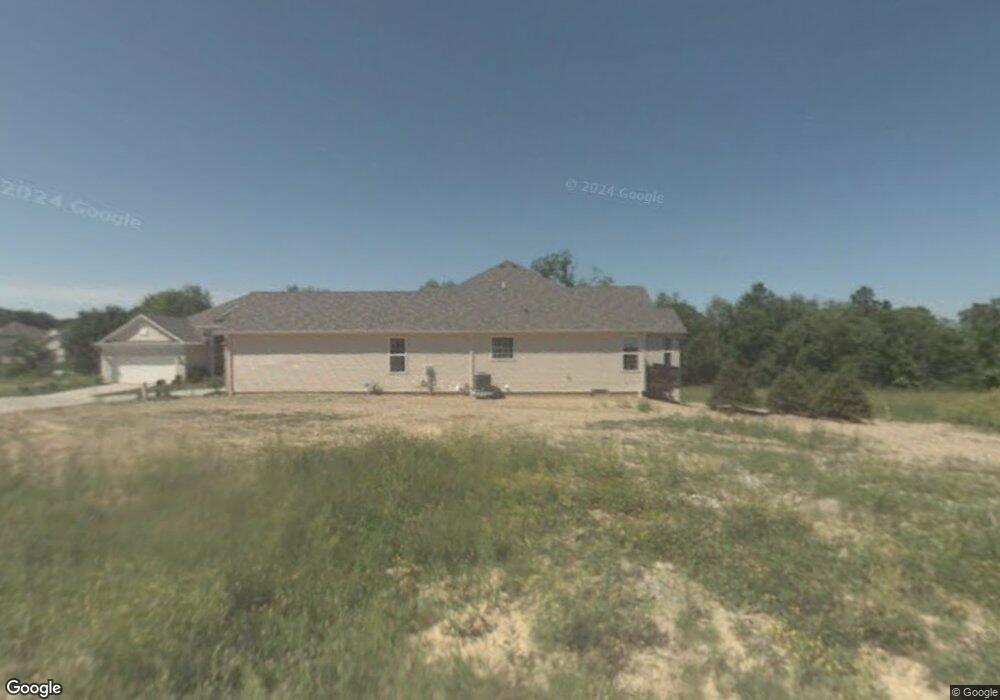
This home is located at 4700 Danforth Reserve, Stow, OH 44224 and is currently estimated at $458,387, approximately $210 per square foot. 4700 Danforth Reserve is a home located in Summit County with nearby schools including Stow-Munroe Falls High School, Primrose School of Hudson, and Holy Family Elementary School.
Ownership History
Date
Name
Owned For
Owner Type
Purchase Details
Closed on
Mar 31, 2025
Sold by
Bamer Sally A
Bought by
Sally Anne Bamer Trust and Bamer
Current Estimated Value
Purchase Details
Closed on
Apr 11, 2008
Sold by
Waterford Crossing Sales Llc
Bought by
Bamer James G and Bamer Sally A
Home Financials for this Owner
Home Financials are based on the most recent Mortgage that was taken out on this home.
Original Mortgage
$290,400
Interest Rate
6.32%
Mortgage Type
Purchase Money Mortgage
Purchase Details
Closed on
Mar 2, 2007
Sold by
Stonebridge Crossing Llc
Bought by
Waterford Crossing Sales Llc
Create a Home Valuation Report for This Property
The Home Valuation Report is an in-depth analysis detailing your home's value as well as a comparison with similar homes in the area
Home Values in the Area
Average Home Value in this Area
Purchase History
| Date | Buyer | Sale Price | Title Company |
|---|---|---|---|
| Sally Anne Bamer Trust | -- | None Listed On Document | |
| Bamer James G | $363,384 | Chicago Title Insurance Co | |
| Waterford Crossing Sales Llc | $327,718 | Chicago Title Ins Co |
Source: Public Records
Mortgage History
| Date | Status | Borrower | Loan Amount |
|---|---|---|---|
| Previous Owner | Bamer James G | $290,400 |
Source: Public Records
Tax History
| Year | Tax Paid | Tax Assessment Tax Assessment Total Assessment is a certain percentage of the fair market value that is determined by local assessors to be the total taxable value of land and additions on the property. | Land | Improvement |
|---|---|---|---|---|
| 2025 | $7,175 | $136,910 | $22,915 | $113,995 |
| 2024 | $7,175 | $136,910 | $22,915 | $113,995 |
| 2023 | $7,175 | $136,910 | $22,915 | $113,995 |
| 2022 | $7,429 | $125,671 | $21,021 | $104,650 |
| 2021 | $6,648 | $125,671 | $21,021 | $104,650 |
| 2020 | $6,533 | $125,670 | $21,020 | $104,650 |
| 2019 | $6,576 | $118,790 | $18,630 | $100,160 |
| 2018 | $6,468 | $118,790 | $18,630 | $100,160 |
| 2017 | $6,352 | $118,790 | $18,630 | $100,160 |
| 2016 | $6,539 | $113,790 | $18,630 | $95,160 |
| 2015 | $6,352 | $113,790 | $18,630 | $95,160 |
| 2014 | $6,358 | $113,790 | $18,630 | $95,160 |
| 2013 | $6,296 | $113,440 | $18,630 | $94,810 |
Source: Public Records
Map
Nearby Homes
- 2279 Becket Cir
- 2188 Duxbury
- 2221 Crockett Cir
- 4623 Cox Dr
- 4704 Red Willow Rd
- 4424 Timberdale Dr Unit 4428
- 4909 Fishcreek Rd
- 1664 Cypress Ct
- 5091 Ridge Meadow Dr
- 1525 Spruce Hill Dr
- 2072 White Oak Dr Unit 2076
- 4916 Friar Rd Unit B
- V/L Norton Rd
- 0 Hibbard Dr
- 5123 Sodalite Dr
- 2066 King Dr
- 4638 Dresher Trail
- 1620 Sapphire Dr
- 2055-2059 Bryn Mawr Dr
- 4399-4403 Cherryhurst Dr
- 4706 Danforth Reserve
- 4694 Danforth Reserve
- 4712 Danforth Reserve
- 4688 Danforth Reserve
- 4718 Danforth Reserve
- 4682 Danforth Reserve
- 4676 Danforth Reserve
- 4724 Danforth Reserve
- 4457 Forest Lake Ct
- 4463 Forest Lake Ct
- 4451 Forest Lake Ct
- 4730 Danforth Reserve
- 4670 Danforth Reserve
- 4664 Danforth Reserve
- 4736 Danforth Reserve
- 4736 Danforth Reserve Unit 72
- 4460 Forest Lake Ct
- 4447 Forest Lake Ct
- 4658 Danforth Reserve
- 5205 Fishcreek Rd
Your Personal Tour Guide
Ask me questions while you tour the home.