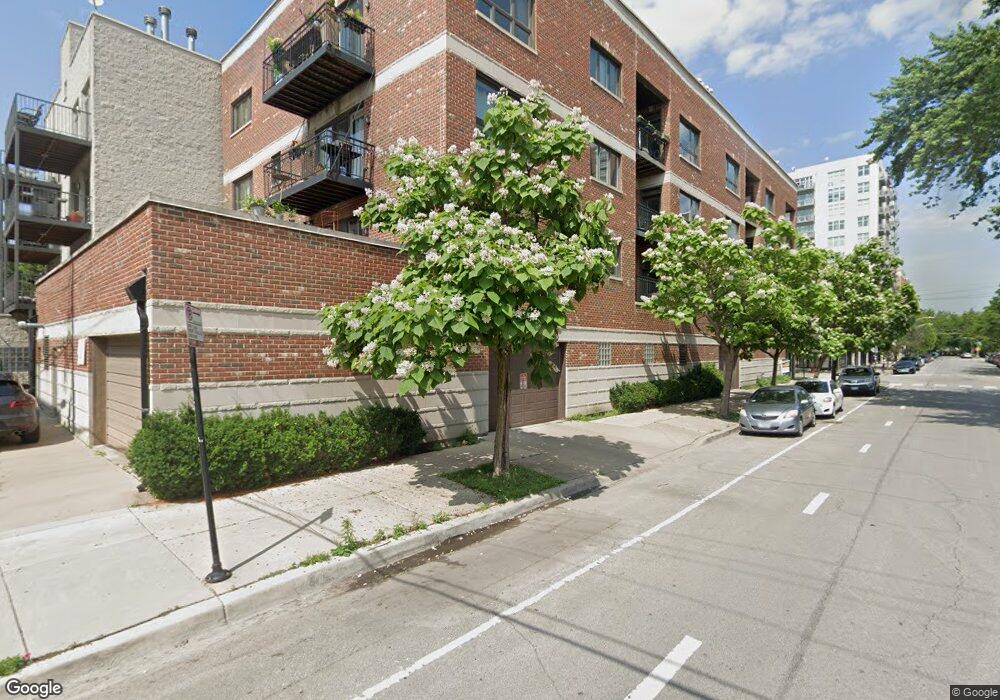
4700 N Kenmore Ave Unit 2D Chicago, IL 60640
Sheridan Park NeighborhoodEstimated Value: $354,000 - $434,881
2
Beds
2
Baths
1,200
Sq Ft
$343/Sq Ft
Est. Value
About This Home
This home is located at 4700 N Kenmore Ave Unit 2D, Chicago, IL 60640 and is currently estimated at $411,720, approximately $343 per square foot. 4700 N Kenmore Ave Unit 2D is a home located in Cook County with nearby schools including Brennemann Elementary School, Senn High School, and St Mary Of The Lake School.
Ownership History
Date
Name
Owned For
Owner Type
Purchase Details
Closed on
Aug 4, 2011
Sold by
Bleier Michael and Bleier Rachel
Bought by
Kurtz Natasha P
Current Estimated Value
Home Financials for this Owner
Home Financials are based on the most recent Mortgage that was taken out on this home.
Original Mortgage
$196,000
Outstanding Balance
$135,581
Interest Rate
4.55%
Mortgage Type
New Conventional
Estimated Equity
$276,139
Purchase Details
Closed on
Sep 27, 2010
Sold by
Smith Hayden P and Bleier Rachel
Bought by
Bleier Rachel
Purchase Details
Closed on
Jun 6, 2006
Sold by
Horne Rebecca A and Harding Rebecca A
Bought by
Smith Hayden P and Vandergeest Rachel
Home Financials for this Owner
Home Financials are based on the most recent Mortgage that was taken out on this home.
Original Mortgage
$289,600
Interest Rate
6.72%
Mortgage Type
Unknown
Create a Home Valuation Report for This Property
The Home Valuation Report is an in-depth analysis detailing your home's value as well as a comparison with similar homes in the area
Home Values in the Area
Average Home Value in this Area
Purchase History
| Date | Buyer | Sale Price | Title Company |
|---|---|---|---|
| Kurtz Natasha P | $231,000 | Multiple | |
| Bleier Rachel | -- | None Available | |
| Smith Hayden P | $362,000 | Attorneys Title Guaranty Fun |
Source: Public Records
Mortgage History
| Date | Status | Borrower | Loan Amount |
|---|---|---|---|
| Open | Kurtz Natasha P | $196,000 | |
| Previous Owner | Smith Hayden P | $289,600 |
Source: Public Records
Tax History Compared to Growth
Tax History
| Year | Tax Paid | Tax Assessment Tax Assessment Total Assessment is a certain percentage of the fair market value that is determined by local assessors to be the total taxable value of land and additions on the property. | Land | Improvement |
|---|---|---|---|---|
| 2024 | $6,615 | $37,245 | $4,262 | $32,983 |
| 2023 | $6,448 | $30,272 | $3,539 | $26,733 |
| 2022 | $6,448 | $30,272 | $3,539 | $26,733 |
| 2021 | $6,313 | $30,272 | $3,539 | $26,733 |
| 2020 | $5,730 | $24,830 | $2,631 | $22,199 |
| 2019 | $5,760 | $27,668 | $2,631 | $25,037 |
| 2018 | $5,662 | $27,668 | $2,631 | $25,037 |
| 2017 | $4,860 | $21,827 | $2,288 | $19,539 |
| 2016 | $4,512 | $21,827 | $2,288 | $19,539 |
| 2015 | $4,137 | $21,827 | $2,288 | $19,539 |
| 2014 | $3,381 | $17,682 | $1,744 | $15,938 |
| 2013 | -- | $17,682 | $1,744 | $15,938 |
Source: Public Records
Map
Nearby Homes
- 1000 W Leland Ave Unit 12G
- 4715 N Racine Ave Unit 305
- 4826 N Winthrop Ave Unit 2S
- 4603 N Racine Ave Unit 403
- 4834 N Kenmore Ave Unit 3N
- 4634 N Racine Ave Unit 3
- 4832 N Winthrop Ave
- 905 W Lakeside Place Unit 2F
- 4641 N Magnolia Ave Unit 3S
- 4516 N Sheridan Rd
- 4652 N Magnolia Ave
- 4848 N Sheridan Rd Unit 710
- 1215 W Gunnison St Unit 205
- 4642 N Magnolia Ave
- 4616 N Magnolia Ave Unit 1
- 4616 N Magnolia Ave Unit 3
- 4612 N Magnolia Ave
- 4879 N Winthrop Ave Unit D
- 1015 W Ainslie St Unit 2
- 906 W Sunnyside Ave Unit 1B
- 4700 N Kenmore Ave Unit 3D
- 4700 N Kenmore Ave Unit 3C
- 4700 N Kenmore Ave Unit P2
- 4700 N Kenmore Ave Unit P1
- 4700 N Kenmore Ave Unit 4C
- 4700 N Kenmore Ave Unit 4B
- 4700 N Kenmore Ave Unit 4A
- 4700 N Kenmore Ave Unit 3A
- 4700 N Kenmore Ave Unit 2B
- 4700 N Kenmore Ave Unit 2A
- 4700 N Kenmore Ave Unit 3B
- 4700 N Kenmore Ave Unit 4D
- 4700 N Kenmore Ave Unit 2N
- 4700 N Kenmore Ave Unit P3
- 4700 N Kenmore Ave Unit P11
- 4700 N Kenmore Ave Unit P8
- 4700 N Kenmore Ave Unit P5
- 4700 N Kenmore Ave Unit 2C
- 4700 N Kenmore Ave Unit P7
- 4700 N Kenmore Ave Unit P9