Estimated Value: $413,000 - $491,000
4
Beds
4
Baths
1,422
Sq Ft
$311/Sq Ft
Est. Value
About This Home
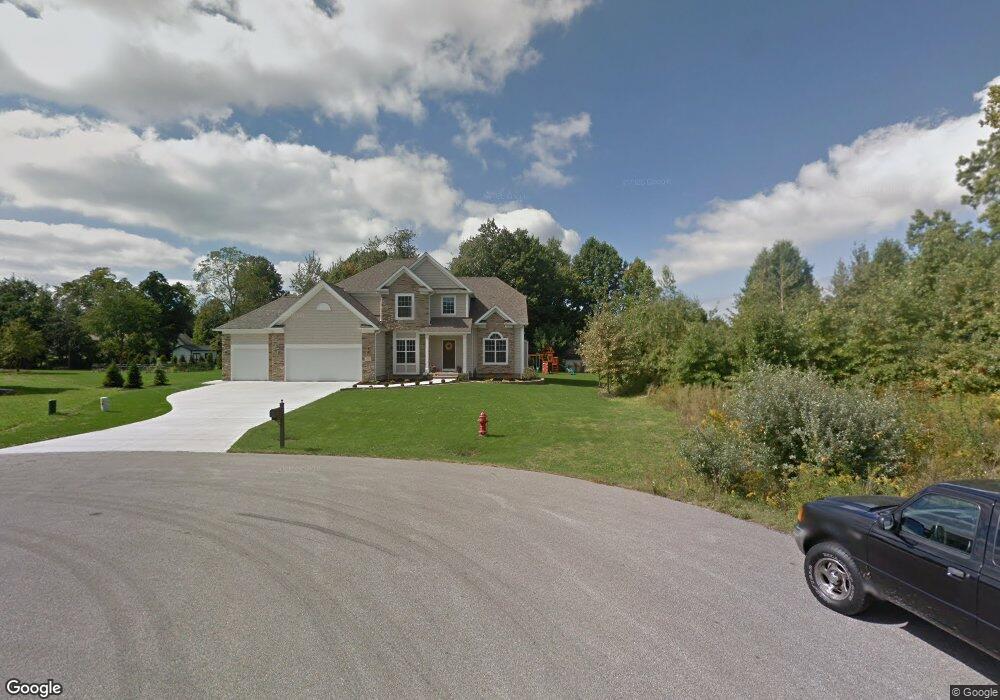
This home is located at 4700 Zackary Ct, Perry, OH 44081 and is currently estimated at $441,947, approximately $310 per square foot. 4700 Zackary Ct is a home with nearby schools including Perry Elementary School, Perry Middle School, and Perry High School.
Ownership History
Date
Name
Owned For
Owner Type
Purchase Details
Closed on
Aug 27, 2012
Sold by
Little Mountain Homes Inc
Bought by
Deans Jason M and Deans Shannon
Current Estimated Value
Home Financials for this Owner
Home Financials are based on the most recent Mortgage that was taken out on this home.
Original Mortgage
$209,142
Outstanding Balance
$142,434
Interest Rate
3.54%
Mortgage Type
FHA
Estimated Equity
$299,513
Purchase Details
Closed on
Jun 5, 2012
Sold by
Deans Jason M
Bought by
Little Mountain Homes Inc
Purchase Details
Closed on
Feb 28, 2012
Sold by
R L Moore Builders Inc
Bought by
Deans Jason M
Purchase Details
Closed on
Aug 18, 2006
Sold by
Loreto Properties Inc
Bought by
R L Moore Builders Inc
Home Financials for this Owner
Home Financials are based on the most recent Mortgage that was taken out on this home.
Original Mortgage
$460,200
Interest Rate
6.88%
Mortgage Type
Purchase Money Mortgage
Create a Home Valuation Report for This Property
The Home Valuation Report is an in-depth analysis detailing your home's value as well as a comparison with similar homes in the area
Purchase History
| Date | Buyer | Sale Price | Title Company |
|---|---|---|---|
| Deans Jason M | $261,500 | All Title Services Inc | |
| Little Mountain Homes Inc | -- | None Available | |
| Deans Jason M | $22,000 | None Available | |
| R L Moore Builders Inc | $368,000 | Chicago Title Insurance Comp |
Source: Public Records
Mortgage History
| Date | Status | Borrower | Loan Amount |
|---|---|---|---|
| Open | Deans Jason M | $209,142 | |
| Previous Owner | R L Moore Builders Inc | $460,200 |
Source: Public Records
Tax History
| Year | Tax Paid | Tax Assessment Tax Assessment Total Assessment is a certain percentage of the fair market value that is determined by local assessors to be the total taxable value of land and additions on the property. | Land | Improvement |
|---|---|---|---|---|
| 2025 | -- | $127,100 | $30,260 | $96,840 |
| 2024 | -- | $127,100 | $30,260 | $96,840 |
| 2023 | $9,532 | $110,360 | $25,210 | $85,150 |
| 2022 | $5,133 | $110,360 | $25,210 | $85,150 |
| 2021 | $4,813 | $110,360 | $25,210 | $85,150 |
| 2020 | $4,453 | $91,970 | $21,010 | $70,960 |
| 2019 | $4,456 | $91,970 | $21,010 | $70,960 |
| 2018 | $4,294 | $91,320 | $21,810 | $69,510 |
| 2017 | $4,401 | $91,320 | $21,810 | $69,510 |
| 2016 | $4,373 | $91,320 | $21,810 | $69,510 |
| 2015 | $4,372 | $91,320 | $21,810 | $69,510 |
| 2014 | $4,289 | $91,320 | $21,810 | $69,510 |
| 2013 | $4,287 | $91,320 | $21,810 | $69,510 |
Source: Public Records
Map
Nearby Homes
- 3181 Azalea Ridge Dr
- 4473 Middle Ridge Rd
- 4390 Middle Ridge Rd
- 3300 Townline Rd
- 17 Hawaiian Dr
- 11 Hawaiian Dr
- 0 Antioch Rd Unit 5162302
- 5470 N Ridge Rd
- V/L Tarpon Cove
- 3930 Wood Rd
- 0 Mcmackin Rd Unit 5102732
- 4815 S Ridge Rd
- 4795 S Ridge Rd
- 4185 Maple St
- 5466 S Ridge Rd
- L 195 S Hidden Village Dr
- L 203 S Hidden Village Dr
- L 224 S Hidden Village Dr
- L 231 S Hidden Village Dr
- L 226 S Hidden Village Dr
- 4701 Zackary Ct
- 4704 Zackary Ct
- 4688 Katie Ct
- 4698 Katie Ct
- 4720 Zackary Ct
- 3230 Azalea Ridge Dr
- SL 38 Zachary Ct
- SL 37 Zachary Ct
- SL 36 Zackary Ct
- SL 39 Zackary Ct
- 3226 Azalea Ridge Dr
- 4678 Katie Ct
- 36 SL Azalea Ridge
- 30 SL Azalea Ridge Dr
- 4689 Katie Ct
- 4691 Regina Ct
- 3234 Azalea Ridge Dr
- 3242 Azalea Ridge Dr
- SL 43 Azalea Ridge Dr
- SL 42 Azalea Ridge Dr
Your Personal Tour Guide
Ask me questions while you tour the home.