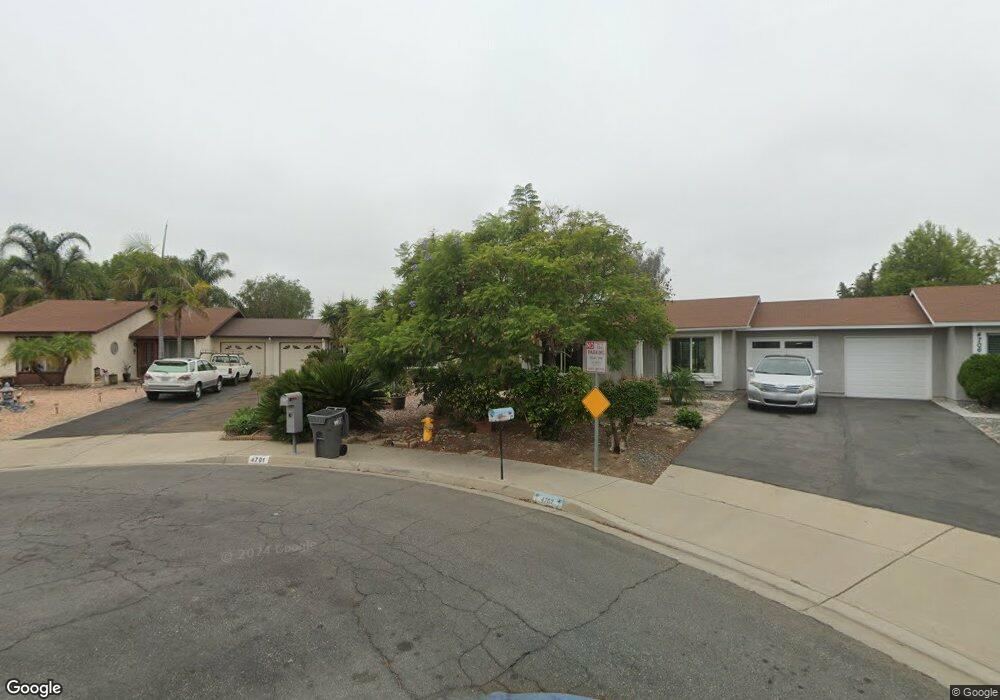
4701 Westerly Ct Oceanside, CA 92056
Peacock NeighborhoodEstimated Value: $510,000 - $572,964
2
Beds
1
Bath
834
Sq Ft
$647/Sq Ft
Est. Value
About This Home
This home is located at 4701 Westerly Ct, Oceanside, CA 92056 and is currently estimated at $539,241, approximately $646 per square foot. 4701 Westerly Ct is a home located in San Diego County with nearby schools including Empresa Elementary School, Roosevelt Middle School, and Vista High School.
Ownership History
Date
Name
Owned For
Owner Type
Purchase Details
Closed on
Jul 3, 2018
Sold by
Kallweit Jaime D and Kallweit Jaime Delle
Bought by
Kallweit Jaime Delle
Current Estimated Value
Purchase Details
Closed on
Apr 19, 2007
Sold by
Rivas Rene A and Jackson Julia M
Bought by
Kallweit Jaime D
Home Financials for this Owner
Home Financials are based on the most recent Mortgage that was taken out on this home.
Original Mortgage
$207,200
Outstanding Balance
$123,201
Interest Rate
6.12%
Mortgage Type
Purchase Money Mortgage
Estimated Equity
$416,040
Purchase Details
Closed on
Apr 6, 1999
Sold by
Jackson Raleigh
Bought by
Jackson Julia M
Purchase Details
Closed on
Sep 12, 1996
Sold by
Rine Blanche G
Bought by
Georges Margaret E
Home Financials for this Owner
Home Financials are based on the most recent Mortgage that was taken out on this home.
Original Mortgage
$46,150
Interest Rate
2.95%
Create a Home Valuation Report for This Property
The Home Valuation Report is an in-depth analysis detailing your home's value as well as a comparison with similar homes in the area
Home Values in the Area
Average Home Value in this Area
Purchase History
| Date | Buyer | Sale Price | Title Company |
|---|---|---|---|
| Kallweit Jaime Delle | -- | None Available | |
| Kallweit Jaime D | $259,000 | Fidelity National Title Co | |
| Jackson Julia M | -- | First American Title | |
| Rivas Rene A | $95,500 | First American Title | |
| Georges Margaret E | $71,000 | Chicago Title Co |
Source: Public Records
Mortgage History
| Date | Status | Borrower | Loan Amount |
|---|---|---|---|
| Open | Kallweit Jaime D | $207,200 | |
| Previous Owner | Georges Margaret E | $46,150 |
Source: Public Records
Tax History
| Year | Tax Paid | Tax Assessment Tax Assessment Total Assessment is a certain percentage of the fair market value that is determined by local assessors to be the total taxable value of land and additions on the property. | Land | Improvement |
|---|---|---|---|---|
| 2025 | $3,910 | $346,978 | $267,939 | $79,039 |
| 2024 | $3,688 | $340,176 | $262,686 | $77,490 |
| 2023 | $3,598 | $333,507 | $257,536 | $75,971 |
| 2022 | $3,587 | $326,969 | $252,487 | $74,482 |
| 2021 | $3,507 | $320,559 | $247,537 | $73,022 |
| 2020 | $3,494 | $317,273 | $244,999 | $72,274 |
| 2019 | $3,442 | $311,053 | $240,196 | $70,857 |
| 2018 | $3,111 | $290,000 | $190,000 | $100,000 |
| 2017 | $70 | $260,000 | $171,000 | $89,000 |
| 2016 | $2,456 | $230,000 | $152,000 | $78,000 |
| 2015 | $2,374 | $220,000 | $146,000 | $74,000 |
| 2014 | $1,930 | $180,000 | $120,000 | $60,000 |
Source: Public Records
Map
Nearby Homes
- 1540 Highridge Dr
- 1413 Panorama Ridge Rd
- 4734 Rim Rock Rd
- 4699 Mystik Rd
- 1521 Temple Heights Dr
- 1523 Temple Heights Dr
- 4538 Sunrise Ridge
- 1702 Havenwood Dr Unit 1702
- 4530 Beverly Glen Dr
- 1400 Darwin Dr
- 1826 Via Quinto
- 1424 Calle Marbella
- 1772 Avenida Segovia
- 4517 Quailridge Dr
- 1789 Avenida Segovia
- 1376 Darwin Dr
- 1668 Avenida Guillermo
- 4325 Via Tercero
- 475 Taylor Dr
- 1560 Via Botero
- 4702 Westerly Ct
- 4705 Westerly Ct
- 4709 Westerly Ct
- 4706 Westerly Ct
- 1570 Boulder Creek Rd
- 4711 Westerly Ct
- 1545 Peacock Blvd
- 1570 Havenwood Dr
- 4703 Crescent Heights Dr
- 4707 Crescent Heights Dr
- 1549 Peacock Blvd
- 4710 Westerly Ct Unit 2
- 4713 Crescent Heights Dr
- 1566 Havenwood Dr
- 1578 Boulder Creek Rd
- 1574 Havenwood Dr
- 4714 Westerly Ct
- 1551 Peacock Blvd
- 4717 Crescent Heights Dr
- 1562 Havenwood Dr
Your Personal Tour Guide
Ask me questions while you tour the home.