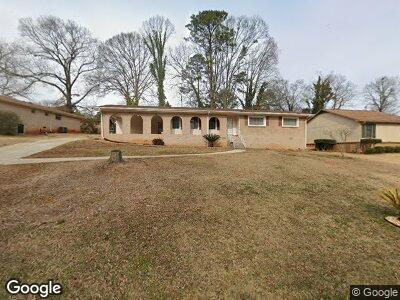
4702 Riverwood Cir Unit 29 Decatur, GA 30035
Southwest DeKalb NeighborhoodEstimated Value: $203,000 - $238,000
3
Beds
2
Baths
1,511
Sq Ft
$149/Sq Ft
Est. Value
About This Home
This home is located at 4702 Riverwood Cir Unit 29, Decatur, GA 30035 and is currently estimated at $224,917, approximately $148 per square foot. 4702 Riverwood Cir Unit 29 is a home located in DeKalb County with nearby schools including Canby Lane Elementary School, Mary McLeod Bethune Middle School, and Towers High School.
Ownership History
Date
Name
Owned For
Owner Type
Purchase Details
Closed on
Dec 21, 2023
Sold by
Jones Tom
Bought by
Young Clive S
Current Estimated Value
Purchase Details
Closed on
Oct 15, 2019
Sold by
Green Carolyn
Bought by
Jones Tom
Home Financials for this Owner
Home Financials are based on the most recent Mortgage that was taken out on this home.
Original Mortgage
$122,405
Interest Rate
3.75%
Mortgage Type
FHA
Purchase Details
Closed on
Jun 27, 1997
Sold by
Gordon Dorothy S
Bought by
Green Carolyn
Home Financials for this Owner
Home Financials are based on the most recent Mortgage that was taken out on this home.
Original Mortgage
$86,800
Interest Rate
7.92%
Mortgage Type
New Conventional
Create a Home Valuation Report for This Property
The Home Valuation Report is an in-depth analysis detailing your home's value as well as a comparison with similar homes in the area
Home Values in the Area
Average Home Value in this Area
Purchase History
| Date | Buyer | Sale Price | Title Company |
|---|---|---|---|
| Young Clive S | $219,800 | -- | |
| Jones Tom | $128,000 | -- | |
| Green Carolyn | $89,500 | -- |
Source: Public Records
Mortgage History
| Date | Status | Borrower | Loan Amount |
|---|---|---|---|
| Previous Owner | Jones Tom | $122,405 | |
| Previous Owner | Green Carolyn | $92,229 | |
| Previous Owner | Green Carolyn | $25,000 | |
| Previous Owner | Green Carolyn | $102,600 | |
| Previous Owner | Green Carolyn | $98,000 | |
| Previous Owner | Green Carolyn | $100,800 | |
| Previous Owner | Green Carolyn | $86,800 |
Source: Public Records
Tax History Compared to Growth
Tax History
| Year | Tax Paid | Tax Assessment Tax Assessment Total Assessment is a certain percentage of the fair market value that is determined by local assessors to be the total taxable value of land and additions on the property. | Land | Improvement |
|---|---|---|---|---|
| 2023 | $2,529 | $87,960 | $10,120 | $77,840 |
| 2022 | $1,934 | $65,320 | $10,120 | $55,200 |
| 2021 | $1,632 | $52,240 | $10,120 | $42,120 |
| 2020 | $1,545 | $48,280 | $10,120 | $38,160 |
| 2019 | $2,172 | $41,440 | $10,120 | $31,320 |
| 2018 | $1,771 | $40,040 | $10,120 | $29,920 |
| 2017 | $1,633 | $29,040 | $10,120 | $18,920 |
| 2016 | $1,749 | $31,600 | $10,120 | $21,480 |
| 2014 | $1,462 | $24,480 | $10,120 | $14,360 |
Source: Public Records
Map
Nearby Homes
- 4701 Riverwood Cir
- 4376 Riverwood Cir
- 4296 Langdon Dr
- 4260 Wesley Hall Dr
- 2370 Wingfoot Place
- 4251 Canby Ln
- 4225 Wesley Hall Ln
- 4239 Canby Ln
- 4194 Wesley Hall Ln
- 4211 Wingfoot Ct
- 2401 Winshire Dr
- 4379 Cross Ln
- 4214 Canby Ln
- 2312 Leslie Brook Dr
- 2419 Leslie Brook Dr
- 4371 Aldergate Dr
- 2469 Newgate Dr
- 4481 Buckingham Cir
- 2352 S Hairston Rd
- 4702 Riverwood Cir Unit 29
- 4702 Riverwood Cir
- 4696 Riverwood Cir
- 4710 Riverwood Cir
- 4323 Riverwood Cir Unit 1
- 4331 Riverwood Cir Unit 1
- 4313 Riverwood Cir Unit 1
- 4688 Riverwood Cir Unit 4
- 4697 Riverwood Cir
- 4339 Riverwood Cir
- 4689 Riverwood Cir
- 4707 Riverwood Cir Unit 4
- 4680 Riverwood Cir
- 4725 Riverwood Cir
- 4719 Riverwood Cir
- 4347 Riverwood Cir
- 4297 Riverwood Cir
- 4711 Riverwood Cir
- 4316 Riverwood Cir Unit 1
- 4324 Riverwood Cir Unit 1