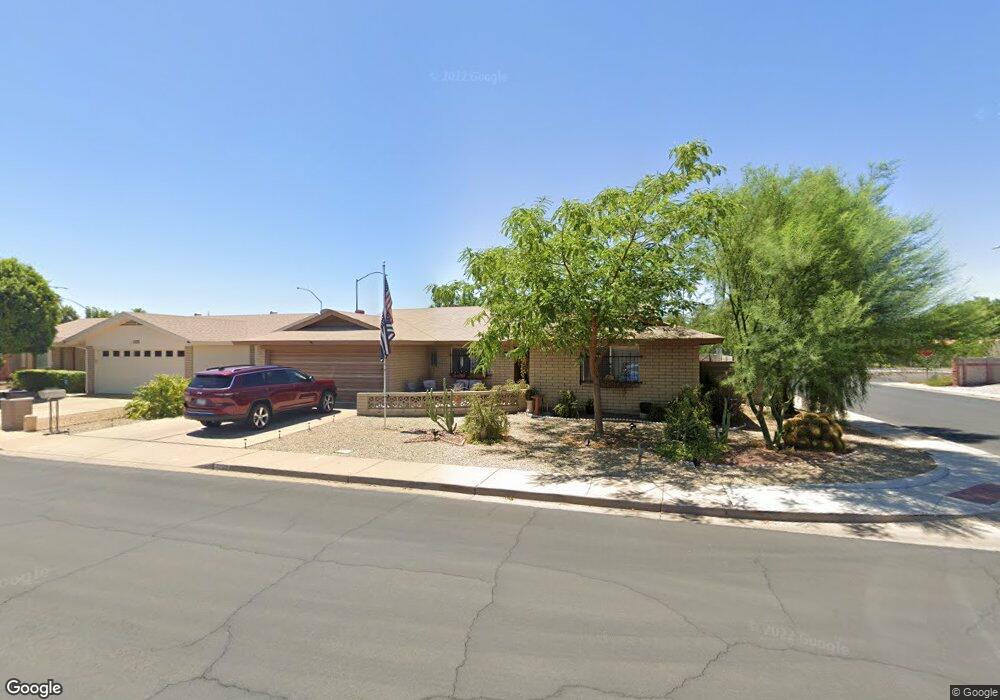
4703 E Flossmoor Cir Mesa, AZ 85206
Sunland Village NeighborhoodEstimated Value: $374,012 - $401,000
2
Beds
2
Baths
1,878
Sq Ft
$208/Sq Ft
Est. Value
About This Home
This home is located at 4703 E Flossmoor Cir, Mesa, AZ 85206 and is currently estimated at $391,003, approximately $208 per square foot. 4703 E Flossmoor Cir is a home located in Maricopa County with nearby schools including Franklin at Brimhall Elementary School, Madison Elementary School, and Franklin West Elementary School.
Ownership History
Date
Name
Owned For
Owner Type
Purchase Details
Closed on
Jun 11, 2018
Sold by
Ferguson Deana and The Ecaterini Fox Special Hous
Bought by
Everhart Richard M and Everhart Linda A
Current Estimated Value
Home Financials for this Owner
Home Financials are based on the most recent Mortgage that was taken out on this home.
Original Mortgage
$244,304
Outstanding Balance
$211,755
Interest Rate
4.6%
Mortgage Type
VA
Estimated Equity
$179,248
Purchase Details
Closed on
Nov 18, 2015
Sold by
Fox Ecaterini
Bought by
Ferguson Deana
Purchase Details
Closed on
Nov 23, 2004
Sold by
Hampton Linda Lee
Bought by
Fox Marvin E and Fox Ecaterini
Home Financials for this Owner
Home Financials are based on the most recent Mortgage that was taken out on this home.
Original Mortgage
$115,000
Interest Rate
5.72%
Mortgage Type
New Conventional
Create a Home Valuation Report for This Property
The Home Valuation Report is an in-depth analysis detailing your home's value as well as a comparison with similar homes in the area
Home Values in the Area
Average Home Value in this Area
Purchase History
| Date | Buyer | Sale Price | Title Company |
|---|---|---|---|
| Everhart Richard M | $236,500 | Equity Title Agency Inc | |
| Ferguson Deana | -- | None Available | |
| Fox Marvin E | $156,500 | Security Title Agency Inc |
Source: Public Records
Mortgage History
| Date | Status | Borrower | Loan Amount |
|---|---|---|---|
| Open | Everhart Richard M | $244,304 | |
| Previous Owner | Fox Marvin E | $115,000 |
Source: Public Records
Tax History
| Year | Tax Paid | Tax Assessment Tax Assessment Total Assessment is a certain percentage of the fair market value that is determined by local assessors to be the total taxable value of land and additions on the property. | Land | Improvement |
|---|---|---|---|---|
| 2025 | $1,390 | $19,774 | -- | -- |
| 2024 | $1,700 | $18,832 | -- | -- |
| 2023 | $1,700 | $28,600 | $5,720 | $22,880 |
| 2022 | $1,664 | $23,660 | $4,730 | $18,930 |
| 2021 | $1,702 | $19,970 | $3,990 | $15,980 |
| 2020 | $1,678 | $18,430 | $3,680 | $14,750 |
| 2019 | $1,557 | $16,860 | $3,370 | $13,490 |
| 2018 | $1,485 | $15,610 | $3,120 | $12,490 |
| 2017 | $1,695 | $13,670 | $2,730 | $10,940 |
| 2016 | $1,406 | $14,660 | $2,930 | $11,730 |
| 2015 | $1,331 | $13,280 | $2,650 | $10,630 |
Source: Public Records
Map
Nearby Homes
- 4719 E Flossmoor Cir
- 4734 E Florian Cir
- 4648 E Florian Ave
- 4647 E Garnet Cir
- 1025 S Roanoke
- 955 S Rochester
- 4557 E Grove Ave
- 4539 E Grove Ave
- 913 S Roanoke
- 4749 E Edgewood Ave
- 4709 E Edgewood Ave
- 1155 S St Paul --
- 4835 E Holmes Ave
- 1021 S Greenfield Rd Unit 1195
- 1021 S Greenfield Rd Unit 1045
- 1021 S Greenfield Rd Unit 1194
- 1021 S Greenfield Rd Unit 1080
- 1021 S Greenfield Rd Unit 1106
- 829 S Roanoke
- 4564 E Edgewood Ave
- 1157 S Quail
- 4711 E Flossmoor Cir
- 1164 S Quail
- 1156 S Quail
- 1156 R S Quail --
- 4704 E Flossmoor Cir
- 1141 S Quail
- 4712 E Flossmoor Cir
- 1148 S Quail
- 1133 S Quail
- 1125 S Quail
- 1140 S Quail
- 4732 E Flossmoor Cir
- 1113 S Quail
- 4743 E Flossmoor Cir
- 4705 E Flower Cir
- 4713 E Flower Cir
- 1105 S Quail
- 4661 E Flower Ave
- 4721 E Flower Cir
Your Personal Tour Guide
Ask me questions while you tour the home.