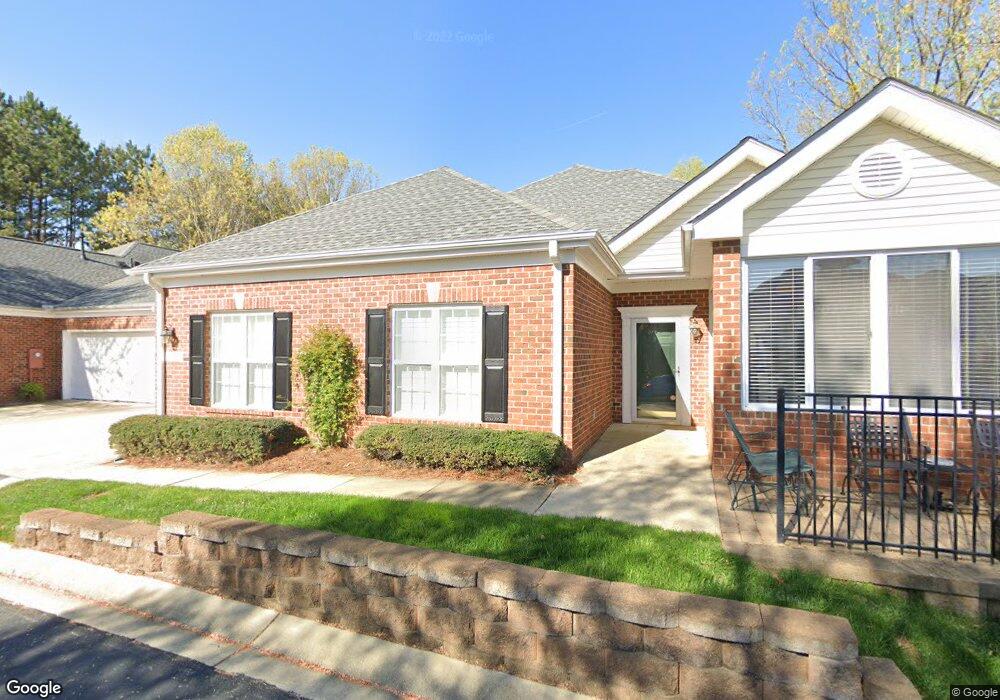
4703 Highland Glen Ct Raleigh, NC 27612
North Hills NeighborhoodEstimated Value: $511,968 - $559,000
3
Beds
2
Baths
1,704
Sq Ft
$311/Sq Ft
Est. Value
About This Home
This home is located at 4703 Highland Glen Ct, Raleigh, NC 27612 and is currently estimated at $530,742, approximately $311 per square foot. 4703 Highland Glen Ct is a home located in Wake County with nearby schools including Lynn Road Elementary School, Carroll Middle, and Sanderson High School.
Ownership History
Date
Name
Owned For
Owner Type
Purchase Details
Closed on
Aug 30, 2012
Sold by
Burris James H and Burris Patricia R
Bought by
Petty Ann Horne
Current Estimated Value
Home Financials for this Owner
Home Financials are based on the most recent Mortgage that was taken out on this home.
Original Mortgage
$95,000
Outstanding Balance
$65,767
Interest Rate
3.58%
Mortgage Type
New Conventional
Estimated Equity
$464,975
Purchase Details
Closed on
May 4, 2005
Sold by
Baer Melvin J and Baer Barbara S
Bought by
Burris James H and Burris Patricia R
Purchase Details
Closed on
Oct 4, 2000
Sold by
Wkb Raleigh Llc
Bought by
Baer Melvin J and Baer Barbara S
Home Financials for this Owner
Home Financials are based on the most recent Mortgage that was taken out on this home.
Original Mortgage
$166,080
Interest Rate
7.97%
Create a Home Valuation Report for This Property
The Home Valuation Report is an in-depth analysis detailing your home's value as well as a comparison with similar homes in the area
Home Values in the Area
Average Home Value in this Area
Purchase History
| Date | Buyer | Sale Price | Title Company |
|---|---|---|---|
| Petty Ann Horne | $282,500 | None Available | |
| Burris James H | $240,000 | -- | |
| Baer Melvin J | $208,000 | -- |
Source: Public Records
Mortgage History
| Date | Status | Borrower | Loan Amount |
|---|---|---|---|
| Open | Petty Ann Horne | $95,000 | |
| Closed | Petty Ann Horne | $15,000 | |
| Previous Owner | Baer Melvin J | $166,080 | |
| Closed | Baer Melvin J | $31,140 |
Source: Public Records
Tax History Compared to Growth
Tax History
| Year | Tax Paid | Tax Assessment Tax Assessment Total Assessment is a certain percentage of the fair market value that is determined by local assessors to be the total taxable value of land and additions on the property. | Land | Improvement |
|---|---|---|---|---|
| 2025 | $4,366 | $498,372 | $150,000 | $348,372 |
| 2024 | $4,348 | $498,372 | $150,000 | $348,372 |
| 2023 | $3,527 | $321,720 | $65,000 | $256,720 |
| 2022 | $3,277 | $321,720 | $65,000 | $256,720 |
| 2021 | $3,150 | $321,720 | $65,000 | $256,720 |
| 2020 | $3,093 | $321,720 | $65,000 | $256,720 |
| 2019 | $2,865 | $245,534 | $45,000 | $200,534 |
| 2018 | $2,703 | $245,534 | $45,000 | $200,534 |
| 2017 | $2,574 | $245,534 | $45,000 | $200,534 |
| 2016 | $2,522 | $245,534 | $45,000 | $200,534 |
| 2015 | $2,636 | $252,596 | $60,000 | $192,596 |
| 2014 | $2,500 | $252,596 | $60,000 | $192,596 |
Source: Public Records
Map
Nearby Homes
- 4622 Ludwell Branch Ct
- 4724 Ludwell Branch Ct
- 4742 Ludwell Branch Ct
- 4508 Leaf Ct
- 1904 French Dr
- 1920 Hillock Dr
- 4830 N Hills Dr
- 5301 Thayer Dr
- 5013 Coronado Dr
- 4300 Edgehill Ct
- 5309 Ridgeloch Place
- 822 Northbrook Dr
- 2009 Philcrest Rd
- 1429 Kershaw Dr
- 5500 N Hills Dr
- 1212 Gunnison Place
- 1116 Kimberly Dr
- 806 Tyrrell Rd
- 802 Tyrrell Rd
- 5418 Ridgeloch Place
- 4702 Old Bern Ct
- 4701 Highland Glen Ct
- 4702 Highland Glen Ct
- 4700 Old Bern Ct
- 4710 Highland Glen Ct
- 4711 Highland Glen Ct
- 4710 Old Bern Ct
- 4700 Highland Glen Ct
- 4620 Ludwell Branch Ct
- 4700 Highland Creek Ct
- 4612 Ludwell Branch Ct
- 4712 Highland Glen Ct
- 4610 Ludwell Branch Ct
- 4713 Highland Glen Ct
- 4712 Old Bern Ct
- 4720 Highland Glen Ct
- 4613 Ludwell Branch Ct
- 4602 Ludwell Branch Ct
- 1801 Kenwyck Manor Way
- 1801 Kenwych Manor Way