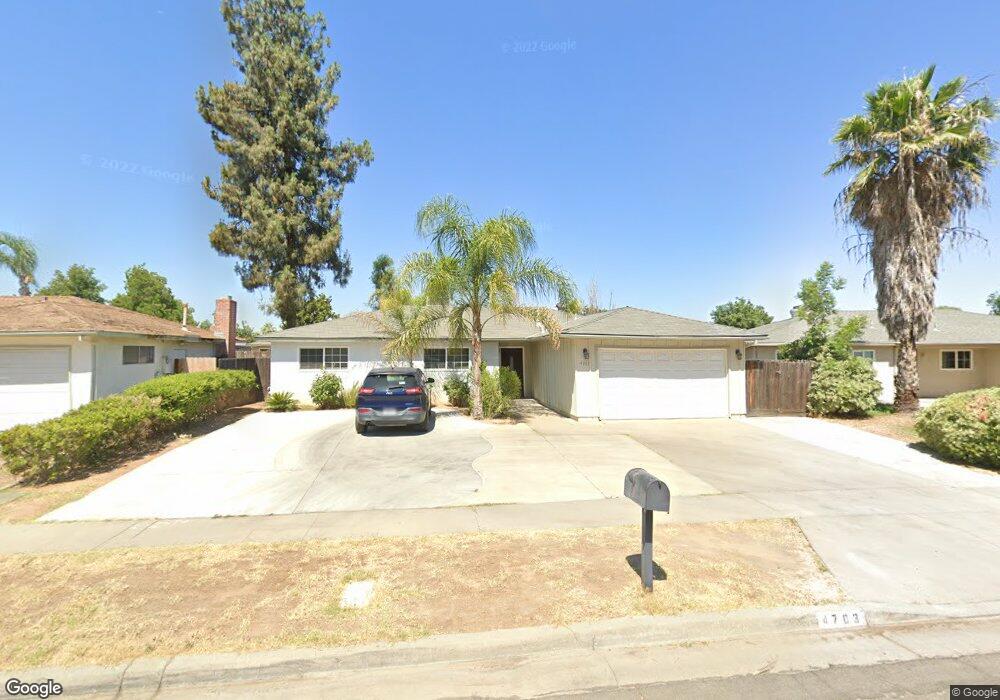
4703 N Hulbert Ave Fresno, CA 93705
Bullard NeighborhoodEstimated Value: $322,172 - $364,000
3
Beds
2
Baths
1,285
Sq Ft
$265/Sq Ft
Est. Value
About This Home
This home is located at 4703 N Hulbert Ave, Fresno, CA 93705 and is currently estimated at $341,043, approximately $265 per square foot. 4703 N Hulbert Ave is a home located in Fresno County with nearby schools including Wilson Elementary School, Fort Miller Middle School, and Fresno High School.
Ownership History
Date
Name
Owned For
Owner Type
Purchase Details
Closed on
Mar 5, 2024
Sold by
Talamayan Edna
Bought by
Edna Talamayan Estate Planning Trust and Talamayan
Current Estimated Value
Purchase Details
Closed on
Feb 29, 2024
Sold by
Talamayan Edna
Bought by
Edna Talamayan Estate Planning Trust and Talamayan
Purchase Details
Closed on
Sep 14, 2023
Sold by
Talamayan Edna and Talamayan Jonathan
Bought by
Talamayan Edna
Purchase Details
Closed on
Sep 13, 2023
Sold by
Talamayan Edna and Talamayan Jonathan
Bought by
Talamayan Edna
Purchase Details
Closed on
Apr 12, 2014
Sold by
Talamayan Edna
Bought by
Talamayan Edna and Talamayan Jonathan
Purchase Details
Closed on
Oct 4, 2002
Sold by
Talamayan William
Bought by
Talamayan Edna
Home Financials for this Owner
Home Financials are based on the most recent Mortgage that was taken out on this home.
Original Mortgage
$104,115
Interest Rate
6.09%
Mortgage Type
FHA
Purchase Details
Closed on
Sep 1, 2002
Sold by
Dunford Neil and Dunford Christine
Bought by
Talamayan Edna
Home Financials for this Owner
Home Financials are based on the most recent Mortgage that was taken out on this home.
Original Mortgage
$104,115
Interest Rate
6.09%
Mortgage Type
FHA
Create a Home Valuation Report for This Property
The Home Valuation Report is an in-depth analysis detailing your home's value as well as a comparison with similar homes in the area
Home Values in the Area
Average Home Value in this Area
Purchase History
| Date | Buyer | Sale Price | Title Company |
|---|---|---|---|
| Edna Talamayan Estate Planning Trust | -- | None Listed On Document | |
| Edna Talamayan Estate Planning Trust | -- | None Listed On Document | |
| Talamayan Edna | -- | None Listed On Document | |
| Talamayan Edna | -- | None Listed On Document | |
| Talamayan Edna | -- | None Available | |
| Talamayan Edna | -- | National Title Company | |
| Talamayan Edna | $106,000 | National Title Company |
Source: Public Records
Mortgage History
| Date | Status | Borrower | Loan Amount |
|---|---|---|---|
| Previous Owner | Talamayan Edna | $104,115 |
Source: Public Records
Tax History Compared to Growth
Tax History
| Year | Tax Paid | Tax Assessment Tax Assessment Total Assessment is a certain percentage of the fair market value that is determined by local assessors to be the total taxable value of land and additions on the property. | Land | Improvement |
|---|---|---|---|---|
| 2025 | $1,924 | $152,776 | $34,747 | $118,029 |
| 2023 | $1,887 | $146,846 | $33,399 | $113,447 |
| 2022 | $1,861 | $143,968 | $32,745 | $111,223 |
| 2021 | $1,811 | $141,146 | $32,103 | $109,043 |
| 2020 | $1,803 | $139,699 | $31,774 | $107,925 |
| 2019 | $1,734 | $136,960 | $31,151 | $105,809 |
| 2018 | $1,696 | $134,276 | $30,541 | $103,735 |
| 2017 | $1,667 | $131,644 | $29,943 | $101,701 |
| 2016 | $1,613 | $129,063 | $29,356 | $99,707 |
| 2015 | $1,507 | $120,500 | $27,400 | $93,100 |
| 2014 | $1,412 | $112,900 | $25,700 | $87,200 |
Source: Public Records
Map
Nearby Homes
- 2151 W Pico Ave
- 4707 N Kavanagh Ave
- 1866 W Santa Ana Ave Unit 101
- 1751 W Santa Ana Ave
- 1749 W Santa Ana Ave
- 1763 W Santa Ana Ave
- 4856 N Hulbert Ave Unit 101
- 4848 N Hulbert Ave Unit 102
- 1705 W Santa Ana Ave
- 4880 N Hulbert Ave Unit 101
- 2013 W Fairmont Ave
- 4908 N Sequoia Ave Unit 102
- 2457 W San Gabriel Ave
- 4484 N Woodson Ave
- 4914 N Sequoia Dr
- 4446 N Crystal Ave
- 1410 W Rialto Ave
- 4924 N Holt Ave Unit 103
- 1484 W Indianapolis Ave
- 4936 N Holt Ave Unit 101
- 4691 N Hulbert Ave
- 4713 N Hulbert Ave
- 4696 N Hughes Ave
- 4681 N Hulbert Ave
- 4718 N Hughes Ave
- 4686 N Hughes Ave
- 4723 N Hulbert Ave
- 4710 N Hulbert Ave
- 4690 N Hulbert Ave
- 4728 N Hughes Ave
- 4671 N Hulbert Ave
- 4674 N Hughes Ave
- 4680 N Hulbert Ave
- 4738 N Hughes Ave
- 4670 N Hulbert Ave
- 4661 N Hulbert Ave
- 4664 N Hughes Ave
- 4695 N Hughes Ave
- 4685 N Hughes Ave
- 4707 N Hughes Ave