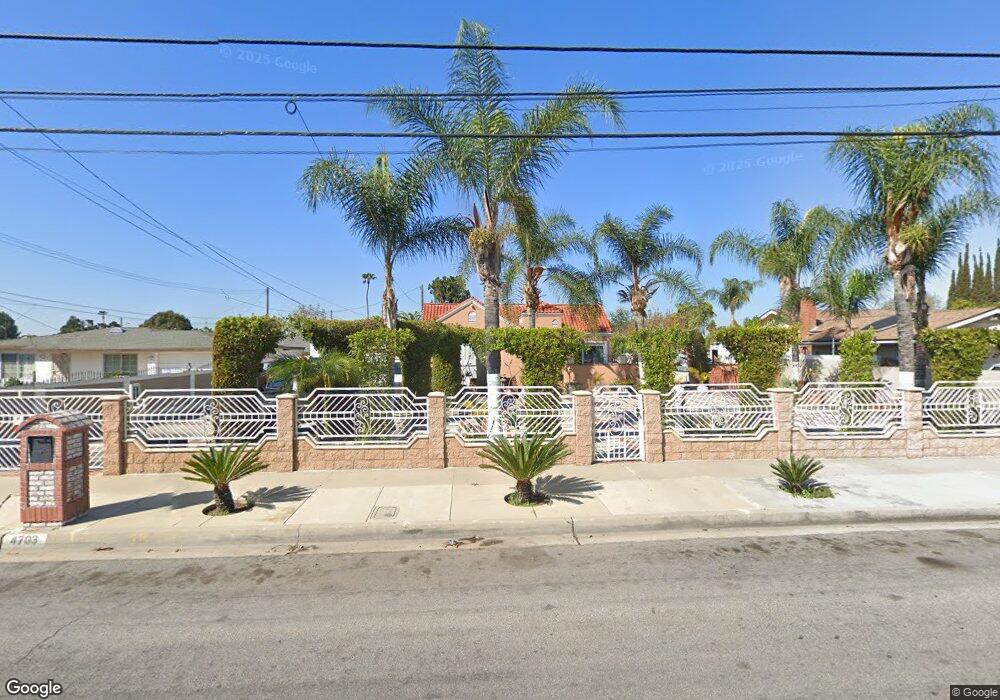
4703 Stewart Ave Baldwin Park, CA 91706
Estimated Value: $753,000 - $784,000
3
Beds
1
Bath
1,457
Sq Ft
$529/Sq Ft
Est. Value
About This Home
This home is located at 4703 Stewart Ave, Baldwin Park, CA 91706 and is currently estimated at $770,558, approximately $528 per square foot. 4703 Stewart Ave is a home located in Los Angeles County with nearby schools including Walnut Elementary, Olive Middle, and Baldwin Park High School.
Ownership History
Date
Name
Owned For
Owner Type
Purchase Details
Closed on
Mar 18, 2021
Sold by
Sanchez Leonel and Calvo Leonel Sanchez
Bought by
Calvo Leonel Sanchez
Current Estimated Value
Home Financials for this Owner
Home Financials are based on the most recent Mortgage that was taken out on this home.
Original Mortgage
$337,000
Outstanding Balance
$302,250
Interest Rate
2.73%
Mortgage Type
New Conventional
Estimated Equity
$468,308
Purchase Details
Closed on
Dec 2, 2003
Sold by
Sanchez Alejandro
Bought by
Sanchez Leonel
Purchase Details
Closed on
Dec 6, 2001
Sold by
Nguyen Mary Chin
Bought by
Sanchez Alejandro
Home Financials for this Owner
Home Financials are based on the most recent Mortgage that was taken out on this home.
Original Mortgage
$172,296
Interest Rate
7.01%
Mortgage Type
FHA
Purchase Details
Closed on
Dec 8, 1998
Sold by
Tai Van Nguyen
Bought by
Nguyen Mary Chin
Purchase Details
Closed on
Jun 28, 1997
Sold by
Cam Lien Thi Tran
Bought by
Vanvannguyen Tia Van
Create a Home Valuation Report for This Property
The Home Valuation Report is an in-depth analysis detailing your home's value as well as a comparison with similar homes in the area
Home Values in the Area
Average Home Value in this Area
Purchase History
| Date | Buyer | Sale Price | Title Company |
|---|---|---|---|
| Calvo Leonel Sanchez | -- | Fidelity National Title | |
| Sanchez Leonel | -- | -- | |
| Sanchez Alejandro | $175,000 | Orange Coast Title | |
| Nguyen Mary Chin | -- | Chicago Title Co | |
| Vanvannguyen Tia Van | -- | -- |
Source: Public Records
Mortgage History
| Date | Status | Borrower | Loan Amount |
|---|---|---|---|
| Open | Calvo Leonel Sanchez | $337,000 | |
| Previous Owner | Sanchez Alejandro | $172,296 |
Source: Public Records
Tax History Compared to Growth
Tax History
| Year | Tax Paid | Tax Assessment Tax Assessment Total Assessment is a certain percentage of the fair market value that is determined by local assessors to be the total taxable value of land and additions on the property. | Land | Improvement |
|---|---|---|---|---|
| 2025 | $4,515 | $331,840 | $220,140 | $111,700 |
| 2024 | $4,515 | $325,334 | $215,824 | $109,510 |
| 2023 | $4,469 | $318,956 | $211,593 | $107,363 |
| 2022 | $4,548 | $312,703 | $207,445 | $105,258 |
| 2021 | $4,479 | $306,573 | $203,378 | $103,195 |
| 2020 | $4,470 | $303,430 | $201,293 | $102,137 |
| 2019 | $4,215 | $297,482 | $197,347 | $100,135 |
| 2018 | $3,920 | $291,650 | $193,478 | $98,172 |
| 2016 | $3,689 | $280,327 | $185,966 | $94,361 |
| 2015 | $3,789 | $276,117 | $183,173 | $92,944 |
| 2014 | $3,739 | $270,709 | $179,585 | $91,124 |
Source: Public Records
Map
Nearby Homes
- 13842 Olive St
- 4409 Merced Ave Unit 15
- 13755 Los Angeles St Unit 5
- 4318 Cutler Ave
- 4355 Baldwin Park Blvd
- 13721 Los Angeles St
- 13725 Los Angeles St Unit H
- 4539 Maine Ave
- 4668 Maine Ave
- 14412 Hallwood Dr
- 4413 Maine Ave
- 13431 Benbow St
- 623 Park Shadow Ct Unit 66
- 102 Park Shadow Ct
- 372 Park Shadow Ct Unit 44
- 14521 Clark St
- 4031 La Rica Ave Unit O
- 4322 Bogart Ave
- 4244 Harlan Ave
- 4000 Stewart Ave Unit 8
- 4711 Stewart Ave
- 4655 Stewart Ave
- 4717 Stewart Ave
- 4647 Stewart Ave
- 4702 Cutler Ave
- 4645 Stewart Ave
- 4706 Cutler Ave
- 4654 Cutler Ave
- 14003 Benwood St
- 4714 Cutler Ave
- 4723 Stewart Ave
- 4646 Cutler Ave
- 4712 Stewart Ave
- 14002 Benwood St
- 14009 Benwood St
- 4641 1/4 Stewart Ave
- 4641 Stewart Ave
- 4716 Stewart Ave
- 13944 Bellbrook St
- 13950 Bellbrook St