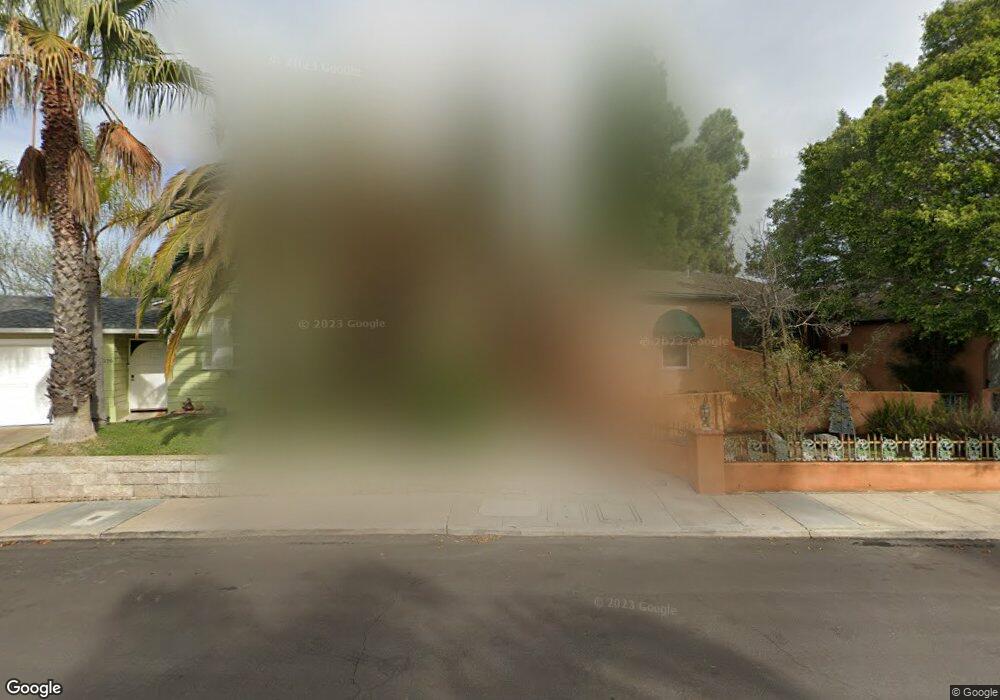
4704 Adams Ave San Diego, CA 92115
Talmadge NeighborhoodEstimated Value: $1,221,000 - $1,418,000
2
Beds
2
Baths
1,422
Sq Ft
$957/Sq Ft
Est. Value
About This Home
This home is located at 4704 Adams Ave, San Diego, CA 92115 and is currently estimated at $1,360,335, approximately $956 per square foot. 4704 Adams Ave is a home located in San Diego County with nearby schools including Franklin Elementary School, Wilson Middle School, and Lewis Middle School.
Ownership History
Date
Name
Owned For
Owner Type
Purchase Details
Closed on
May 29, 2012
Sold by
Miller Kenneth David and Branden Tamara Ellen
Bought by
Miller Kenneth David and Branden Tamara Ellen
Current Estimated Value
Home Financials for this Owner
Home Financials are based on the most recent Mortgage that was taken out on this home.
Original Mortgage
$80,000
Interest Rate
3.84%
Mortgage Type
New Conventional
Purchase Details
Closed on
Dec 18, 2001
Sold by
Branden Tamara E
Bought by
Miller Kenneth David and Branden Tamara Ellen
Purchase Details
Closed on
Sep 25, 1997
Sold by
Sanders Robert B
Bought by
Branden Tamara E
Home Financials for this Owner
Home Financials are based on the most recent Mortgage that was taken out on this home.
Original Mortgage
$214,600
Outstanding Balance
$34,206
Interest Rate
7.36%
Estimated Equity
$1,326,129
Purchase Details
Closed on
Oct 3, 1991
Purchase Details
Closed on
Aug 12, 1985
Create a Home Valuation Report for This Property
The Home Valuation Report is an in-depth analysis detailing your home's value as well as a comparison with similar homes in the area
Home Values in the Area
Average Home Value in this Area
Purchase History
| Date | Buyer | Sale Price | Title Company |
|---|---|---|---|
| Miller Kenneth David | -- | Accommodation | |
| Miller Kenneth David | -- | Stewart Title Of California | |
| Miller Kenneth David | -- | -- | |
| Branden Tamara E | $280,000 | Fidelity National Title | |
| -- | $290,000 | -- | |
| -- | $125,000 | -- |
Source: Public Records
Mortgage History
| Date | Status | Borrower | Loan Amount |
|---|---|---|---|
| Closed | Miller Kenneth David | $80,000 | |
| Open | Branden Tamara E | $214,600 |
Source: Public Records
Tax History Compared to Growth
Tax History
| Year | Tax Paid | Tax Assessment Tax Assessment Total Assessment is a certain percentage of the fair market value that is determined by local assessors to be the total taxable value of land and additions on the property. | Land | Improvement |
|---|---|---|---|---|
| 2025 | $5,442 | $447,068 | $223,534 | $223,534 |
| 2024 | $5,442 | $438,302 | $219,151 | $219,151 |
| 2023 | $5,322 | $429,708 | $214,854 | $214,854 |
| 2022 | $5,177 | $421,284 | $210,642 | $210,642 |
| 2021 | $5,141 | $413,024 | $206,512 | $206,512 |
| 2020 | $5,079 | $408,790 | $204,395 | $204,395 |
| 2019 | $4,989 | $400,776 | $200,388 | $200,388 |
| 2018 | $4,667 | $392,918 | $196,459 | $196,459 |
| 2017 | $4,553 | $385,214 | $192,607 | $192,607 |
| 2016 | $4,480 | $377,662 | $188,831 | $188,831 |
| 2015 | $4,415 | $371,990 | $185,995 | $185,995 |
| 2014 | $4,346 | $364,704 | $182,352 | $182,352 |
Source: Public Records
Map
Nearby Homes
- 4734 Miracle Dr
- 4550 Norma Dr
- 4482 47th St
- 4482 48th St
- 4481 Estrella Ave Unit 1-10
- 4730 Winona Ave
- 4551 Highland Ave
- 4768 Caroline Dr
- 4576 44th St
- 4386 Adams Ave
- 4455 Winona Ave
- 5018 Monroe Ave
- 4904 El Cajon Blvd Unit 1
- 4349 Adams Ave
- 4931 Lorraine Dr
- 5028 Monroe Ave
- 4613 Janet Place
- 4811 E Alder Dr
- 4354 N Talmadge Dr
- 4306 Aldine Dr Unit 1 to 6, 1 to 3 total