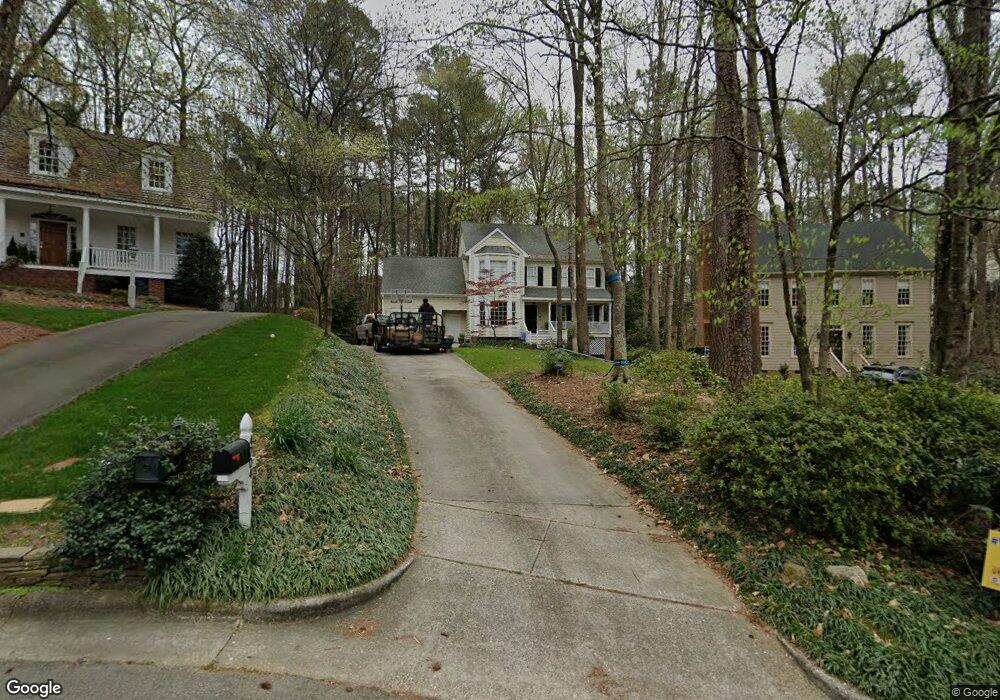
4704 Woodsmith Place Raleigh, NC 27609
North Hills NeighborhoodEstimated Value: $805,000 - $1,086,000
4
Beds
4
Baths
2,830
Sq Ft
$327/Sq Ft
Est. Value
About This Home
This home is located at 4704 Woodsmith Place, Raleigh, NC 27609 and is currently estimated at $925,991, approximately $327 per square foot. 4704 Woodsmith Place is a home located in Wake County with nearby schools including Brooks Elementary, Carroll Middle, and Sanderson High School.
Ownership History
Date
Name
Owned For
Owner Type
Purchase Details
Closed on
Oct 9, 2015
Sold by
Holderness Penn and Holderness Kimberly
Bought by
Halsey Karen B and Halsey Joshua D
Current Estimated Value
Home Financials for this Owner
Home Financials are based on the most recent Mortgage that was taken out on this home.
Original Mortgage
$364,200
Outstanding Balance
$286,549
Interest Rate
3.88%
Mortgage Type
New Conventional
Estimated Equity
$639,442
Purchase Details
Closed on
Jul 26, 2007
Sold by
Ashford Laura B and Lavy Steve
Bought by
Holderness Penn and Holderness Kimberly
Home Financials for this Owner
Home Financials are based on the most recent Mortgage that was taken out on this home.
Original Mortgage
$319,920
Interest Rate
6.71%
Mortgage Type
New Conventional
Purchase Details
Closed on
May 25, 2004
Sold by
Ellyson Gail W and Ellyson David S
Bought by
Ashford Laura B
Purchase Details
Closed on
Jul 1, 2003
Sold by
Pridgen Charles Douglas and Pridgen Mary J
Bought by
Ellyson David S and Ellyson Gail W
Create a Home Valuation Report for This Property
The Home Valuation Report is an in-depth analysis detailing your home's value as well as a comparison with similar homes in the area
Home Values in the Area
Average Home Value in this Area
Purchase History
| Date | Buyer | Sale Price | Title Company |
|---|---|---|---|
| Halsey Karen B | $428,500 | Attorney | |
| Holderness Penn | $400,000 | None Available | |
| Ashford Laura B | $292,000 | None Available | |
| Ellyson David S | $225,000 | -- |
Source: Public Records
Mortgage History
| Date | Status | Borrower | Loan Amount |
|---|---|---|---|
| Open | Halsey Karen B | $364,200 | |
| Previous Owner | Holderness Penn | $319,920 |
Source: Public Records
Tax History Compared to Growth
Tax History
| Year | Tax Paid | Tax Assessment Tax Assessment Total Assessment is a certain percentage of the fair market value that is determined by local assessors to be the total taxable value of land and additions on the property. | Land | Improvement |
|---|---|---|---|---|
| 2025 | $6,870 | $785,492 | $400,000 | $385,492 |
| 2024 | $6,701 | $769,204 | $400,000 | $369,204 |
| 2023 | $5,279 | $482,468 | $200,000 | $282,468 |
| 2022 | $4,905 | $482,468 | $200,000 | $282,468 |
| 2021 | $4,714 | $482,468 | $200,000 | $282,468 |
| 2020 | $4,629 | $482,468 | $200,000 | $282,468 |
| 2019 | $5,167 | $444,141 | $180,000 | $264,141 |
| 2018 | $4,873 | $444,141 | $180,000 | $264,141 |
| 2017 | $4,640 | $444,141 | $180,000 | $264,141 |
| 2016 | $4,545 | $444,141 | $180,000 | $264,141 |
| 2015 | -- | $404,260 | $140,000 | $264,260 |
| 2014 | -- | $404,260 | $140,000 | $264,260 |
Source: Public Records
Map
Nearby Homes
- 822 Northbrook Dr
- 806 Tyrrell Rd
- 802 Tyrrell Rd
- 909 Tyrrell Rd
- 913 Tyrrell Rd
- 4830 N Hills Dr
- 1116 Kimberly Dr
- 716 Davidson St
- 1212 Gunnison Place
- 3811+3815 Yadkin Dr
- 4724 Ludwell Branch Ct
- 4742 Ludwell Branch Ct
- 1429 Kershaw Dr
- 4907 Yadkin Dr
- 1900 Hillock Dr
- 5001 Rampart St
- 4204 Union St
- 613 Sampson St
- 1021 Manchester Dr
- 5500 N Hills Dr
- 4704 Woodsmith Ct
- 4708 Woodsmith Place
- 4700 Woodsmith Place
- 4712 Woodsmith Place
- 4604 Gramercy Ct
- 810 Northbrook Dr
- 4709 Woodsmith Place
- 806 Northbrook Dr
- 4705 Woodsmith Place
- 4701 Woodsmith Place
- 826 Northbrook Dr
- 4701 Woodsmith Ct
- 830 Northbrook Dr
- 4605 Gramercy Ct
- 818 Northbrook Dr
- 1301 Kimberly Dr
- 4616 Gramercy Ct
- 4609 Gramercy Ct
- 814 Northbrook Dr
- 1221 Kimberly Dr