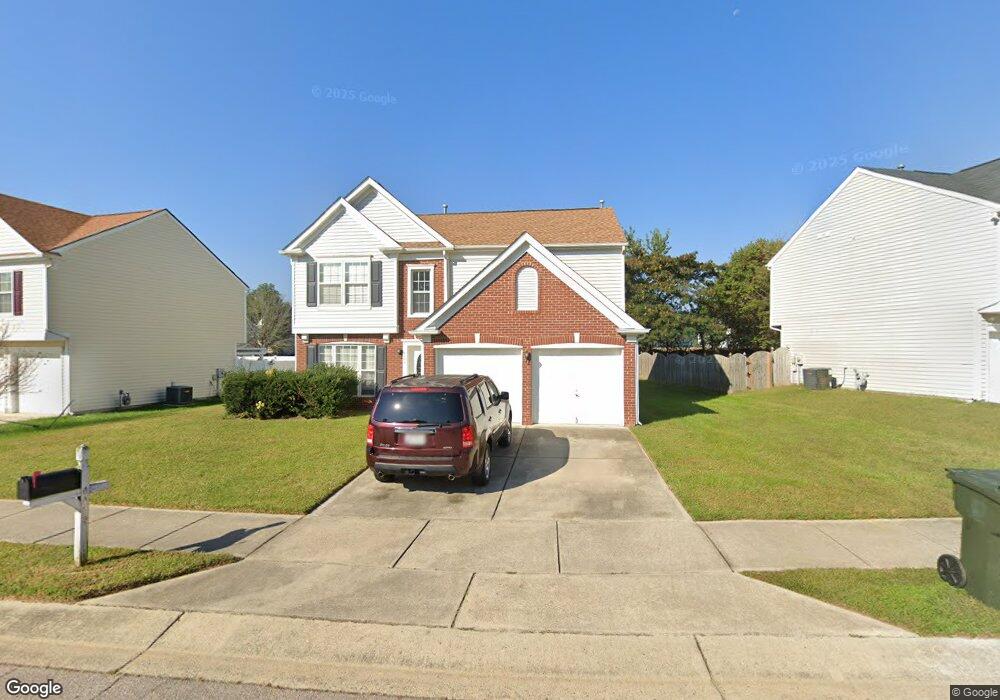
4705 Cardinal Grove Blvd Raleigh, NC 27616
Northeast Raleigh NeighborhoodEstimated Value: $362,000 - $396,000
4
Beds
3
Baths
1,845
Sq Ft
$206/Sq Ft
Est. Value
About This Home
This home is located at 4705 Cardinal Grove Blvd, Raleigh, NC 27616 and is currently estimated at $380,471, approximately $206 per square foot. 4705 Cardinal Grove Blvd is a home located in Wake County with nearby schools including Sanford Creek Elementary School, River Bend Middle, and Rolesville High School.
Ownership History
Date
Name
Owned For
Owner Type
Purchase Details
Closed on
Dec 9, 2019
Sold by
Opendoor Property Trust I Llc
Bought by
Adewumi Adeleke
Current Estimated Value
Home Financials for this Owner
Home Financials are based on the most recent Mortgage that was taken out on this home.
Original Mortgage
$201,450
Outstanding Balance
$178,126
Interest Rate
3.75%
Mortgage Type
New Conventional
Estimated Equity
$202,345
Purchase Details
Closed on
Oct 3, 2019
Sold by
Williams Gladden E
Bought by
Opendoor Property Trust
Purchase Details
Closed on
Jul 31, 2015
Sold by
Hines Latricia and Williams Gladden E
Bought by
Williams Gladden E
Purchase Details
Closed on
Jun 16, 2000
Sold by
Pulte Home Corporation
Bought by
Williams Gladden E and Williams Latricia I
Home Financials for this Owner
Home Financials are based on the most recent Mortgage that was taken out on this home.
Original Mortgage
$139,300
Interest Rate
8.27%
Create a Home Valuation Report for This Property
The Home Valuation Report is an in-depth analysis detailing your home's value as well as a comparison with similar homes in the area
Home Values in the Area
Average Home Value in this Area
Purchase History
| Date | Buyer | Sale Price | Title Company |
|---|---|---|---|
| Adewumi Adeleke | $237,000 | First American Mortgage Sln | |
| Opendoor Property Trust | $230,500 | None Available | |
| Williams Gladden E | -- | Attorney | |
| Williams Gladden E | $147,000 | -- |
Source: Public Records
Mortgage History
| Date | Status | Borrower | Loan Amount |
|---|---|---|---|
| Open | Adewumi Adeleke | $201,450 | |
| Previous Owner | Williams Gladden E | $139,300 |
Source: Public Records
Tax History Compared to Growth
Tax History
| Year | Tax Paid | Tax Assessment Tax Assessment Total Assessment is a certain percentage of the fair market value that is determined by local assessors to be the total taxable value of land and additions on the property. | Land | Improvement |
|---|---|---|---|---|
| 2025 | $3,210 | $365,743 | $110,000 | $255,743 |
| 2024 | $3,196 | $365,743 | $110,000 | $255,743 |
| 2023 | $2,735 | $249,098 | $52,000 | $197,098 |
| 2022 | $2,542 | $249,098 | $52,000 | $197,098 |
| 2021 | $2,444 | $249,098 | $52,000 | $197,098 |
| 2020 | $2,399 | $249,098 | $52,000 | $197,098 |
| 2019 | $2,094 | $178,993 | $36,000 | $142,993 |
| 2018 | $1,976 | $178,993 | $36,000 | $142,993 |
| 2017 | $1,882 | $178,993 | $36,000 | $142,993 |
| 2016 | $1,844 | $178,993 | $36,000 | $142,993 |
| 2015 | $1,887 | $180,303 | $36,000 | $144,303 |
| 2014 | $1,790 | $180,303 | $36,000 | $144,303 |
Source: Public Records
Map
Nearby Homes
- 4440 Cardinal Grove Blvd
- 4800 Arbor Lodge Dr
- 5325 Marthonna Way
- 5915 River Landings Dr
- 4416 Walker Hallow St
- 4821 Heathshire Dr
- 5208 Windmere Chase Dr
- 4348 Karlbrook Ln
- 5012 Silverdene St
- 4508 Brintons Cottage St
- 5321 Glass Ridge Rd
- 4252 Rockdell Hall St
- 5525 Buffaloe Rd
- 6009 River Landings Dr
- 4416 Brintons Cottage St
- 4236 Saubranch Hill St
- 4139 Davis Meadow St
- 4809 Kaycee Ct
- 5200 Fieldwood Ct
- 6429 Pathfinder Way
- 4709 Cardinal Grove Blvd
- 4701 Cardinal Grove Blvd
- 5621 Orchard Gate Way
- 4715 Cardinal Grove Blvd
- 5617 Orchard Gate Way
- 4704 Cardinal Grove Blvd
- 4708 Cardinal Grove Blvd
- 4700 Cardinal Grove Blvd
- 5609 Orchard Gate Way
- 4725 Cardinal Grove Blvd
- 4712 Cardinal Grove Blvd
- 5628 Orchard Gate Way
- 4628 Cardinal Grove Blvd
- 5624 Orchard Gate Way
- 4720 Cardinal Grove Blvd
- 5620 Orchard Gate Way
- 4733 Cardinal Grove Blvd
- 4716 Cardinal Grove Blvd
- 4724 Cardinal Grove Blvd
- 4624 Cardinal Grove Blvd