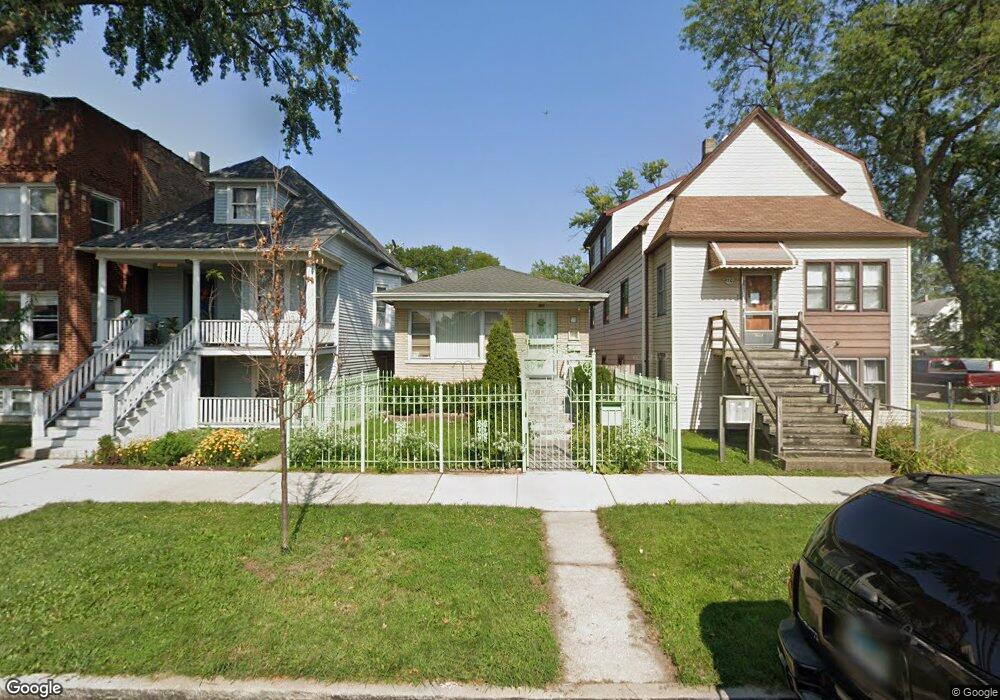
4705 N Harding Ave Chicago, IL 60625
Albany Park NeighborhoodEstimated Value: $405,000 - $432,000
2
Beds
1
Bath
1,040
Sq Ft
$406/Sq Ft
Est. Value
About This Home
This home is located at 4705 N Harding Ave, Chicago, IL 60625 and is currently estimated at $422,539, approximately $406 per square foot. 4705 N Harding Ave is a home located in Cook County with nearby schools including Haugan Elementary School, Roosevelt High School, and ASPIRA Haugan Middle School.
Ownership History
Date
Name
Owned For
Owner Type
Purchase Details
Closed on
Sep 9, 2024
Sold by
Delimios Virginia M
Bought by
Delimios Virginia M and De Limios Nenita
Current Estimated Value
Purchase Details
Closed on
Nov 26, 2003
Sold by
Delimios Nenita and Canonizado Nina De Limios
Bought by
Delimios Deogracias S and Delimios Virginia
Purchase Details
Closed on
Dec 8, 2000
Sold by
Pagulayan Genalin P
Bought by
Delimios Deogracia S and Delimios Virginia
Home Financials for this Owner
Home Financials are based on the most recent Mortgage that was taken out on this home.
Original Mortgage
$193,500
Interest Rate
7.8%
Purchase Details
Closed on
May 28, 1996
Sold by
Moral Leonardo D
Bought by
Pagulayan Genalin P
Home Financials for this Owner
Home Financials are based on the most recent Mortgage that was taken out on this home.
Original Mortgage
$126,278
Interest Rate
7.97%
Mortgage Type
FHA
Create a Home Valuation Report for This Property
The Home Valuation Report is an in-depth analysis detailing your home's value as well as a comparison with similar homes in the area
Home Values in the Area
Average Home Value in this Area
Purchase History
| Date | Buyer | Sale Price | Title Company |
|---|---|---|---|
| Delimios Virginia M | -- | None Listed On Document | |
| Delimios Deogracias S | -- | -- | |
| Delimios Deogracia S | $215,000 | Chicago Title Insurance Co | |
| Pagulayan Genalin P | $130,000 | -- |
Source: Public Records
Mortgage History
| Date | Status | Borrower | Loan Amount |
|---|---|---|---|
| Previous Owner | Delimios Deogracia S | $193,500 | |
| Previous Owner | Pagulayan Genalin P | $126,278 |
Source: Public Records
Tax History Compared to Growth
Tax History
| Year | Tax Paid | Tax Assessment Tax Assessment Total Assessment is a certain percentage of the fair market value that is determined by local assessors to be the total taxable value of land and additions on the property. | Land | Improvement |
|---|---|---|---|---|
| 2024 | $3,337 | $34,001 | $10,938 | $23,063 |
| 2023 | $3,356 | $30,000 | $8,750 | $21,250 |
| 2022 | $3,356 | $30,000 | $8,750 | $21,250 |
| 2021 | $3,194 | $30,000 | $8,750 | $21,250 |
| 2020 | $3,158 | $20,332 | $4,531 | $15,801 |
| 2019 | $3,223 | $22,846 | $4,531 | $18,315 |
| 2018 | $3,166 | $22,846 | $4,531 | $18,315 |
| 2017 | $3,594 | $25,219 | $4,062 | $21,157 |
| 2016 | $3,964 | $25,219 | $4,062 | $21,157 |
| 2015 | $3,811 | $25,219 | $4,062 | $21,157 |
| 2014 | $3,877 | $25,819 | $3,750 | $22,069 |
| 2013 | $3,890 | $25,819 | $3,750 | $22,069 |
Source: Public Records
Map
Nearby Homes
- 4624 N Springfield Ave
- 4614 N Springfield Ave
- 4731 N Keystone Ave
- 4602 N Springfield Ave
- 4855 N Harding Ave Unit 2
- 3752 W Giddings St Unit 3
- 3849 W Ainslie St Unit 1
- 4855 N Springfield Ave Unit 3
- 4845 N Keystone Ave Unit 1S
- 3908 W Ainslie St Unit G
- 4829 N Karlov Ave
- 4537 N Karlov Ave
- 4461 N Pulaski Rd
- 3711 W Lawrence Ave
- 4901 N Avers Ave Unit 2
- 3816 W Ainslie St Unit 1
- 4909 N Avers Ave Unit 3
- 4834 N Ridgeway Ave
- 4923 N Pulaski Rd
- 4515 N Hamlin Ave
- 4707 N Harding Ave
- 4709 N Harding Ave
- 4711 N Harding Ave
- 4701 N Harding Ave Unit 3
- 4715 N Harding Ave
- 4706 N Springfield Ave
- 4702 N Springfield Ave
- 4657 N Harding Ave
- 4708 N Springfield Ave
- 4721 N Harding Ave
- 3906 W Leland Ave
- 4714 N Springfield Ave
- 4655 N Harding Ave
- 4716 N Springfield Ave
- 4725 N Harding Ave
- 4725 N Harding Ave
- 4708 N Harding Ave
- 4704 N Harding Ave
- 4710 N Harding Ave
- 4653 N Harding Ave