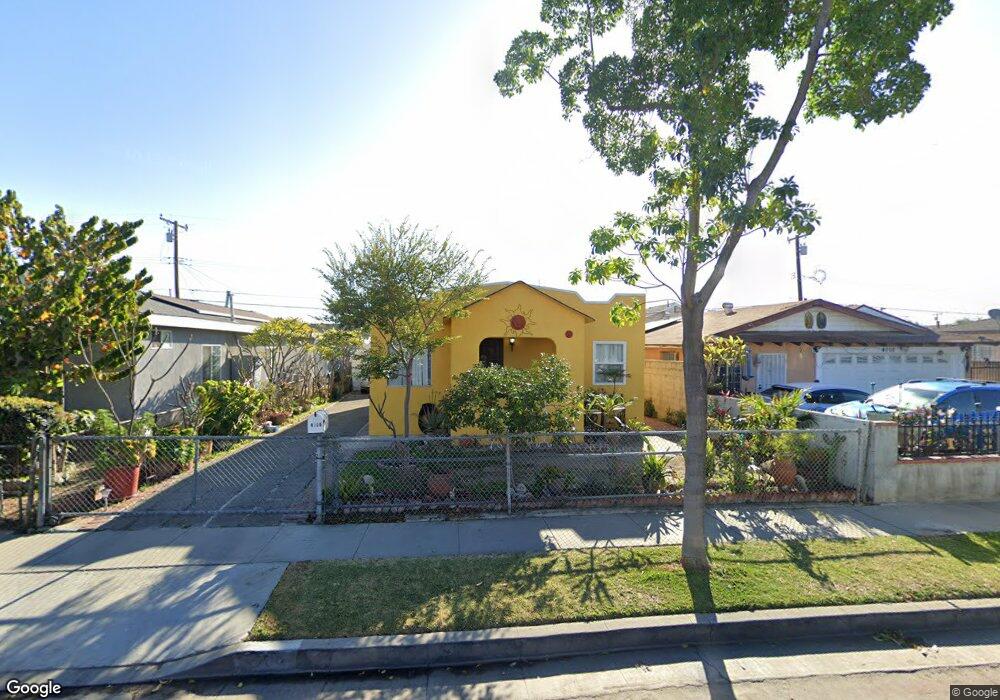
4706 Myrtle St Pico Rivera, CA 90660
Estimated Value: $512,000 - $621,000
2
Beds
1
Bath
780
Sq Ft
$741/Sq Ft
Est. Value
About This Home
This home is located at 4706 Myrtle St, Pico Rivera, CA 90660 and is currently estimated at $577,638, approximately $740 per square foot. 4706 Myrtle St is a home located in Los Angeles County with nearby schools including Montebello Gardens Elementary School, La Merced Intermediate School, and Montebello High School.
Ownership History
Date
Name
Owned For
Owner Type
Purchase Details
Closed on
Feb 1, 2017
Sold by
Cota Maritza
Bought by
Cota Regulo Galaviz and Cota Maritza
Current Estimated Value
Purchase Details
Closed on
Aug 29, 2016
Sold by
Galaviz Regulo Cota
Bought by
Cota Maritza and Cota Delia Lizzette
Purchase Details
Closed on
Jul 18, 2006
Sold by
Galaviz Paula C
Bought by
Galaviz Regulo Cota
Home Financials for this Owner
Home Financials are based on the most recent Mortgage that was taken out on this home.
Original Mortgage
$150,000
Interest Rate
6.17%
Mortgage Type
Purchase Money Mortgage
Purchase Details
Closed on
Oct 18, 1993
Sold by
Galaviz Paula C
Bought by
Galaviz Regulo Cota
Home Financials for this Owner
Home Financials are based on the most recent Mortgage that was taken out on this home.
Original Mortgage
$59,500
Interest Rate
6.95%
Create a Home Valuation Report for This Property
The Home Valuation Report is an in-depth analysis detailing your home's value as well as a comparison with similar homes in the area
Home Values in the Area
Average Home Value in this Area
Purchase History
| Date | Buyer | Sale Price | Title Company |
|---|---|---|---|
| Cota Regulo Galaviz | -- | Nextitle | |
| Cota Maritza | -- | None Available | |
| Galaviz Regulo Cota | -- | Chicago Title Co | |
| Galaviz Regulo Cota | -- | Benefit Land Title Company | |
| Galaviz Regulo Cota | -- | Benefit Land Title Company |
Source: Public Records
Mortgage History
| Date | Status | Borrower | Loan Amount |
|---|---|---|---|
| Previous Owner | Galaviz Regulo Cota | $150,000 | |
| Previous Owner | Galaviz Regulo Cota | $59,500 | |
| Closed | Cota Regulo Galaviz | $0 |
Source: Public Records
Tax History
| Year | Tax Paid | Tax Assessment Tax Assessment Total Assessment is a certain percentage of the fair market value that is determined by local assessors to be the total taxable value of land and additions on the property. | Land | Improvement |
|---|---|---|---|---|
| 2025 | $2,869 | $172,420 | $113,139 | $59,281 |
| 2024 | $2,869 | $169,040 | $110,921 | $58,119 |
| 2023 | $2,853 | $165,727 | $108,747 | $56,980 |
| 2022 | $2,751 | $162,478 | $106,615 | $55,863 |
| 2021 | $2,607 | $159,293 | $104,525 | $54,768 |
| 2019 | $2,505 | $154,571 | $101,426 | $53,145 |
| 2018 | $2,433 | $151,541 | $99,438 | $52,103 |
| 2016 | $2,323 | $145,659 | $95,578 | $50,081 |
| 2015 | $2,205 | $143,472 | $94,143 | $49,329 |
| 2014 | $2,185 | $140,662 | $92,299 | $48,363 |
Source: Public Records
Map
Nearby Homes
- 4724 Orange St
- 4753 Orange St
- 4739 Ivy St
- 312 N Poplar Ave
- 424 Bradley Ave
- 8630 Elba St
- 132 N 2nd St
- 4660 Paramount Blvd
- 344 N 1st St
- 4424 Calada Ave
- 8509 Beverly Blvd Unit 76
- 8509 Beverly Blvd Unit 24
- 8509 Beverly Blvd Unit 74
- 4139 Paramount Blvd Unit 18
- 416 W Cleveland Ave
- 5259 Calico Ave
- 8835 Las Posas St
- 653 N Raywood Ave
- 4918 Rosemead Blvd
- 9035 Hightree St
Your Personal Tour Guide
Ask me questions while you tour the home.