Estimated Value: $654,000 - $957,000
3
Beds
2
Baths
1,998
Sq Ft
$420/Sq Ft
Est. Value
About This Home
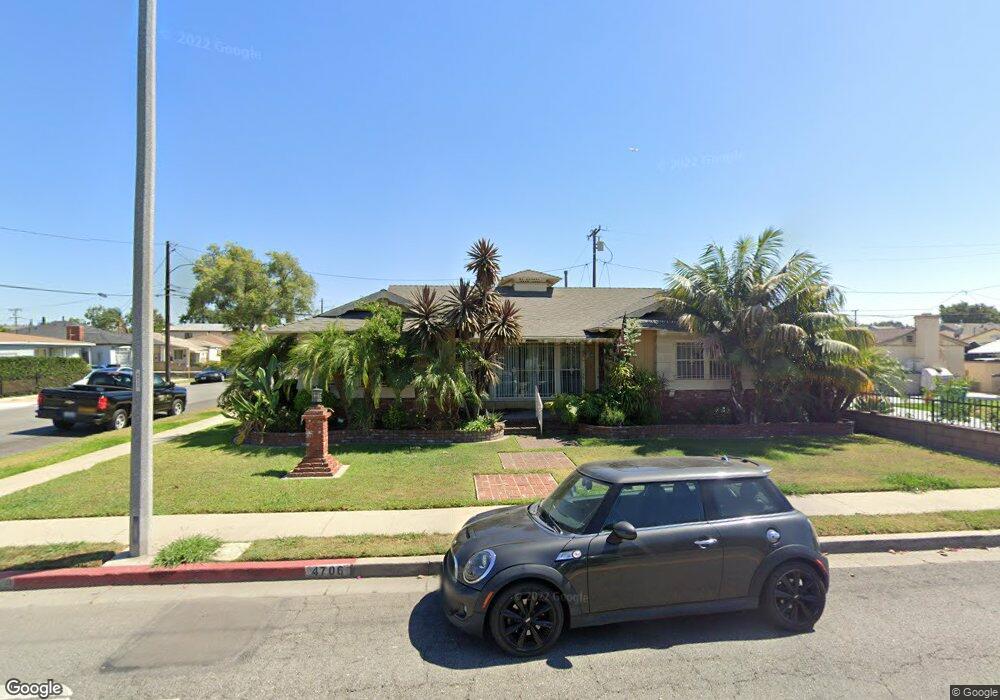
This home is located at 4706 Nevada St, Bell, CA 90201 and is currently estimated at $838,971, approximately $419 per square foot. 4706 Nevada St is a home located in Los Angeles County with nearby schools including Woodlawn Avenue Elementary School, Orchard Academies 2b School, and Bell High School.
Ownership History
Date
Name
Owned For
Owner Type
Purchase Details
Closed on
Jul 6, 2010
Sold by
Knollwood Investment Capital Llc
Bought by
Montanez Randy and Montanez Cecilia S
Current Estimated Value
Home Financials for this Owner
Home Financials are based on the most recent Mortgage that was taken out on this home.
Original Mortgage
$305,880
Outstanding Balance
$204,780
Interest Rate
4.87%
Mortgage Type
FHA
Estimated Equity
$634,191
Purchase Details
Closed on
Apr 29, 2010
Sold by
Ramirez Victor A and Ramirez Wilma M
Bought by
Knollwood Investment Capital Llc
Purchase Details
Closed on
Nov 6, 2006
Sold by
Bank Of The West
Bought by
Ramirez Victor A and Ramirez Wilma M
Home Financials for this Owner
Home Financials are based on the most recent Mortgage that was taken out on this home.
Original Mortgage
$476,000
Interest Rate
6.5%
Mortgage Type
Purchase Money Mortgage
Purchase Details
Closed on
Feb 4, 1998
Sold by
Jordan Joyce F
Bought by
Jordan Joyce F and Joyce F Jordan Trust
Create a Home Valuation Report for This Property
The Home Valuation Report is an in-depth analysis detailing your home's value as well as a comparison with similar homes in the area
Home Values in the Area
Average Home Value in this Area
Purchase History
| Date | Buyer | Sale Price | Title Company |
|---|---|---|---|
| Montanez Randy | $310,000 | Fidelity National Title Co | |
| Knollwood Investment Capital Llc | $265,000 | Fidelity National Title Co | |
| Ramirez Victor A | $595,000 | First American Title Co | |
| Jordan Joyce F | -- | -- |
Source: Public Records
Mortgage History
| Date | Status | Borrower | Loan Amount |
|---|---|---|---|
| Open | Montanez Randy | $305,880 | |
| Previous Owner | Ramirez Victor A | $476,000 |
Source: Public Records
Tax History Compared to Growth
Tax History
| Year | Tax Paid | Tax Assessment Tax Assessment Total Assessment is a certain percentage of the fair market value that is determined by local assessors to be the total taxable value of land and additions on the property. | Land | Improvement |
|---|---|---|---|---|
| 2025 | $9,847 | $408,302 | $190,889 | $217,413 |
| 2024 | $9,847 | $400,297 | $187,147 | $213,150 |
| 2023 | $9,732 | $392,449 | $183,478 | $208,971 |
| 2022 | $9,481 | $384,755 | $179,881 | $204,874 |
| 2021 | $9,414 | $377,211 | $176,354 | $200,857 |
| 2019 | $9,233 | $356,029 | $171,124 | $184,905 |
| 2018 | $8,945 | $349,049 | $167,769 | $181,280 |
| 2016 | $5,545 | $335,497 | $161,255 | $174,242 |
| 2015 | $5,458 | $330,458 | $158,833 | $171,625 |
| 2014 | $5,437 | $323,986 | $155,722 | $168,264 |
Source: Public Records
Map
Nearby Homes
- 6704 Vinevale Ave
- 4860 Bell Ave
- 4610 Weik Ave
- 6833 Crafton Ave
- 6336 Pala Ave
- 6212 Alamo Ave
- 7021 Walker Ave
- 4858 Live Oak St
- 4313 Florence Ave
- 6117 Alamo Ave
- 4305 Florence Ave
- 5162 E Florence Ave Unit 58
- 6000 Vinevale Ave
- 6910 Chanslor Ave
- 4114 Beck Ave
- 5958 Alamo Ave
- 4026 Gage Ave
- 4215 Hartle Ave
- 5231 1/2 Clara St
- 4301 E 60th St
- 4702 Nevada St
- 6617 Mayflower Ave
- 4682 Nevada St
- 4703 Bell Ave
- 4703 Bell Place
- 6618 Mayflower Ave
- 6615 Vinevale Ave
- 4707 Nevada St
- 6620 Mayflower Ave
- 4703 Nevada St
- 4678 Nevada St
- 6624 Mayflower Ave
- 6608 Mayflower Ave
- 4683 Nevada St
- 4679 Bell Place
- 6630 Mayflower Ave
- 6606 Mayflower Ave
- 4674 Nevada St
- 4679 Nevada St
- 4707 Bell Place