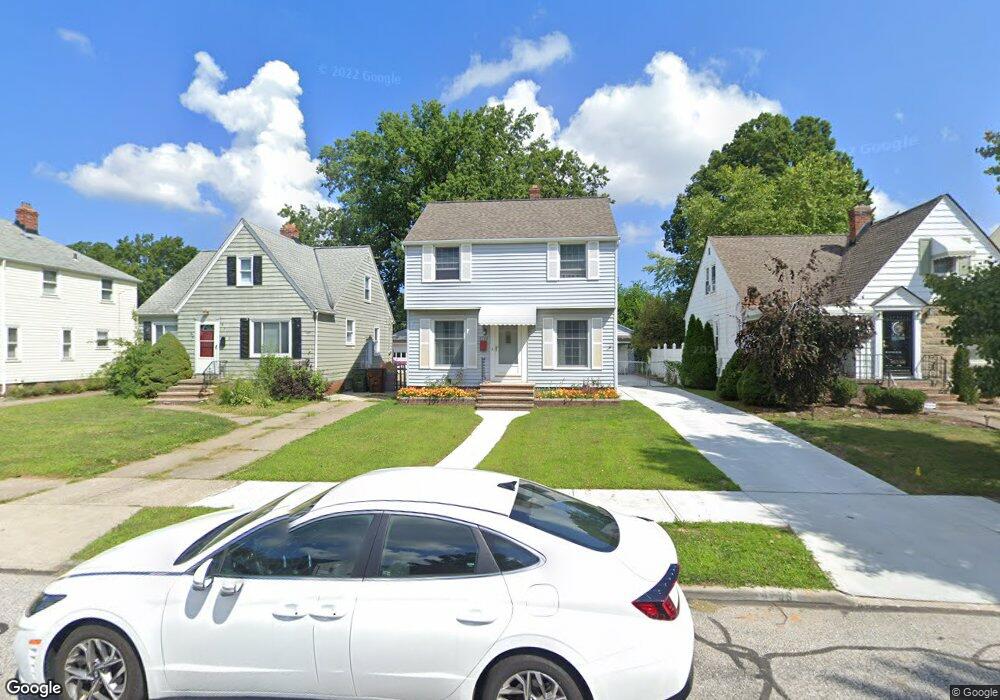
4706 Pershing Ave Cleveland, OH 44134
Estimated Value: $185,000 - $214,000
4
Beds
1
Bath
1,161
Sq Ft
$173/Sq Ft
Est. Value
About This Home
This home is located at 4706 Pershing Ave, Cleveland, OH 44134 and is currently estimated at $201,295, approximately $173 per square foot. 4706 Pershing Ave is a home located in Cuyahoga County with nearby schools including Thoreau Park Elementary School, Shiloh Middle School, and Parma High School.
Ownership History
Date
Name
Owned For
Owner Type
Purchase Details
Closed on
Mar 21, 2007
Sold by
Krovich Mark S and Krovich Kris L
Bought by
Wilmink John M and Wilmink Jane E
Current Estimated Value
Home Financials for this Owner
Home Financials are based on the most recent Mortgage that was taken out on this home.
Original Mortgage
$119,050
Outstanding Balance
$72,099
Interest Rate
6.27%
Mortgage Type
FHA
Estimated Equity
$129,196
Purchase Details
Closed on
Mar 15, 1990
Sold by
Coyne Teresa M
Bought by
Krovich Mark S
Purchase Details
Closed on
Nov 21, 1988
Sold by
Grabski Teresa M
Bought by
Coyne Teresa M
Purchase Details
Closed on
Aug 13, 1987
Sold by
Potoczak Thomas E and Potoczak Diane F
Bought by
Grabski Teresa M
Purchase Details
Closed on
Jan 1, 1975
Bought by
Potoczak Thomas E and Potoczak Diane F
Create a Home Valuation Report for This Property
The Home Valuation Report is an in-depth analysis detailing your home's value as well as a comparison with similar homes in the area
Home Values in the Area
Average Home Value in this Area
Purchase History
| Date | Buyer | Sale Price | Title Company |
|---|---|---|---|
| Wilmink John M | $120,000 | Real Living Title Agency L | |
| Krovich Mark S | $85,000 | -- | |
| Coyne Teresa M | -- | -- | |
| Grabski Teresa M | $63,000 | -- | |
| Potoczak Thomas E | -- | -- |
Source: Public Records
Mortgage History
| Date | Status | Borrower | Loan Amount |
|---|---|---|---|
| Open | Wilmink John M | $119,050 |
Source: Public Records
Tax History Compared to Growth
Tax History
| Year | Tax Paid | Tax Assessment Tax Assessment Total Assessment is a certain percentage of the fair market value that is determined by local assessors to be the total taxable value of land and additions on the property. | Land | Improvement |
|---|---|---|---|---|
| 2024 | $3,471 | $56,980 | $11,025 | $45,955 |
| 2023 | $2,981 | $41,830 | $9,100 | $32,730 |
| 2022 | $2,952 | $41,830 | $9,100 | $32,730 |
| 2021 | $3,036 | $41,830 | $9,100 | $32,730 |
| 2020 | $2,659 | $32,170 | $7,000 | $25,170 |
| 2019 | $2,545 | $91,900 | $20,000 | $71,900 |
| 2018 | $2,421 | $32,170 | $7,000 | $25,170 |
| 2017 | $2,445 | $28,630 | $5,250 | $23,380 |
| 2016 | $2,430 | $28,630 | $5,250 | $23,380 |
| 2015 | $2,321 | $28,630 | $5,250 | $23,380 |
| 2014 | $2,321 | $29,230 | $5,360 | $23,870 |
Source: Public Records
Map
Nearby Homes
- 5521 W 48th St
- 4420 Torrington Ave
- 4409 Milford Ave
- 5000 Torrington Ave
- 5212 Wood Ave
- 4005 Pershing Ave
- 4000 Pershing Ave
- 3910 Wood Ave
- 3710 Wood Ave
- 4323 Russell Ave
- 4910 Russell Ave
- 4915 Tuxedo Ave
- 5815 Westlake Ave
- 5432 State Rd
- 4439 Woodway Ave
- 4212 Tuxedo Ave
- 5914 Forest Ave
- 3714 Russell Ave
- 5618 Bradley Ave
- 4315 Woodway Ave
- 4710 Pershing Ave
- 4702 Pershing Ave
- 4714 Pershing Ave
- 4614 Pershing Ave
- 4718 Pershing Ave
- 4610 Pershing Ave
- 4709 Torrington Ave
- 4705 Torrington Ave
- 4722 Pershing Ave
- 4606 Pershing Ave
- 4713 Torrington Ave
- 4701 Torrington Ave
- 4613 Torrington Ave
- 4717 Torrington Ave
- 4707 Pershing Ave
- 4711 Pershing Ave
- 4703 Pershing Ave
- 4602 Pershing Ave
- 4609 Torrington Ave
- 4715 Pershing Ave