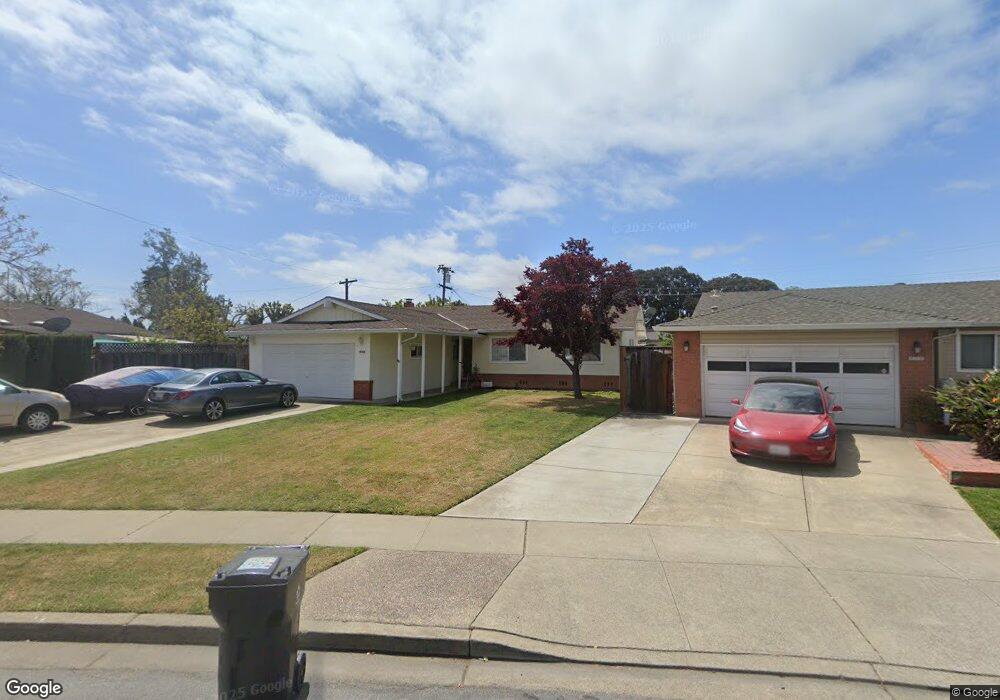
4706 Valpey Park Ave Fremont, CA 94538
Grimmer NeighborhoodEstimated Value: $1,424,000 - $1,653,000
3
Beds
2
Baths
1,368
Sq Ft
$1,139/Sq Ft
Est. Value
About This Home
This home is located at 4706 Valpey Park Ave, Fremont, CA 94538 and is currently estimated at $1,558,220, approximately $1,139 per square foot. 4706 Valpey Park Ave is a home located in Alameda County with nearby schools including Harvey Green Elementary School, John M. Horner Junior High School, and Irvington High School.
Ownership History
Date
Name
Owned For
Owner Type
Purchase Details
Closed on
Nov 21, 2012
Sold by
Liu Xiaomu
Bought by
Liu Xiaomu and Xiaomu Liu Revocable Trust
Current Estimated Value
Purchase Details
Closed on
Mar 28, 2011
Sold by
Lemke Stanley Everette
Bought by
Liu Xiaomu
Home Financials for this Owner
Home Financials are based on the most recent Mortgage that was taken out on this home.
Original Mortgage
$417,000
Outstanding Balance
$278,376
Interest Rate
4.12%
Mortgage Type
New Conventional
Estimated Equity
$1,279,844
Purchase Details
Closed on
Mar 17, 2005
Sold by
Lemke Stanley Everette and Lemke Mary C
Bought by
Lemke Stanley Everette and Lemke Mary C
Home Financials for this Owner
Home Financials are based on the most recent Mortgage that was taken out on this home.
Original Mortgage
$105,000
Interest Rate
5.6%
Mortgage Type
New Conventional
Create a Home Valuation Report for This Property
The Home Valuation Report is an in-depth analysis detailing your home's value as well as a comparison with similar homes in the area
Home Values in the Area
Average Home Value in this Area
Purchase History
| Date | Buyer | Sale Price | Title Company |
|---|---|---|---|
| Liu Xiaomu | -- | None Available | |
| Liu Xiaomu | $547,000 | Orange Coast Title Company | |
| Lemke Stanley Everette | -- | Placer Title Company |
Source: Public Records
Mortgage History
| Date | Status | Borrower | Loan Amount |
|---|---|---|---|
| Open | Liu Xiaomu | $417,000 | |
| Previous Owner | Lemke Stanley Everette | $105,000 |
Source: Public Records
Tax History Compared to Growth
Tax History
| Year | Tax Paid | Tax Assessment Tax Assessment Total Assessment is a certain percentage of the fair market value that is determined by local assessors to be the total taxable value of land and additions on the property. | Land | Improvement |
|---|---|---|---|---|
| 2025 | $8,609 | $700,761 | $210,228 | $490,533 |
| 2024 | $8,609 | $687,025 | $206,107 | $480,918 |
| 2023 | $8,376 | $673,558 | $202,067 | $471,491 |
| 2022 | $8,263 | $660,354 | $198,106 | $462,248 |
| 2021 | $8,062 | $647,407 | $194,222 | $453,185 |
| 2020 | $8,068 | $640,771 | $192,231 | $448,540 |
| 2019 | $7,978 | $628,212 | $188,463 | $439,749 |
| 2018 | $7,822 | $615,900 | $184,770 | $431,130 |
| 2017 | $7,628 | $603,827 | $181,148 | $422,679 |
| 2016 | $7,496 | $591,990 | $177,597 | $414,393 |
| 2015 | $7,395 | $583,101 | $174,930 | $408,171 |
| 2014 | $7,267 | $571,680 | $171,504 | $400,176 |
Source: Public Records
Map
Nearby Homes
- 43163 Grimmer Terrace
- 42932 Peachwood St
- 4860 Bryce Canyon Park Dr
- 4537 Capewood Terrace
- 4533 Capewood Terrace
- 4309 Bora Ave
- 48 Eagle Green
- 92 Delta Green
- 5341 Audubon Park Ct
- 41882 Gifford St
- 262 Manitoba Green
- 202 Manitoba Terrace
- 4751 Wadsworth Ct
- 208 Manitoba Terrace
- 261 Manitoba Green Unit 261
- 257 Manitoba Green
- 40696 Robin St
- 42759 Newport Dr
- 3923 Wildflower Common Unit 19
- 3872 Wildflower Common Unit 27
- 4714 Valpey Park Ave
- 4701 Seneca Park Ave
- 4719 Seneca Park Ave
- 4722 Valpey Park Ave
- 42796 Deauville Park Ct
- 4727 Seneca Park Ave
- 42794 Deauville Park Ct
- 42798 Deauville Park Ct
- 4721 Valpey Park Ave
- 4723 Valpey Park Ave
- 42790 Deauville Park Ct
- 4745 Seneca Park Ave
- 4730 Valpey Park Ave
- 4718 Seneca Park Ave
- 4720 Seneca Park Ave
- 42804 Deauville Park Ct
- 4737 Valpey Park Ave
- 4736 Valpey Park Ave
- 42788 Deauville Park Ct
- 4621 Seneca Park Ave