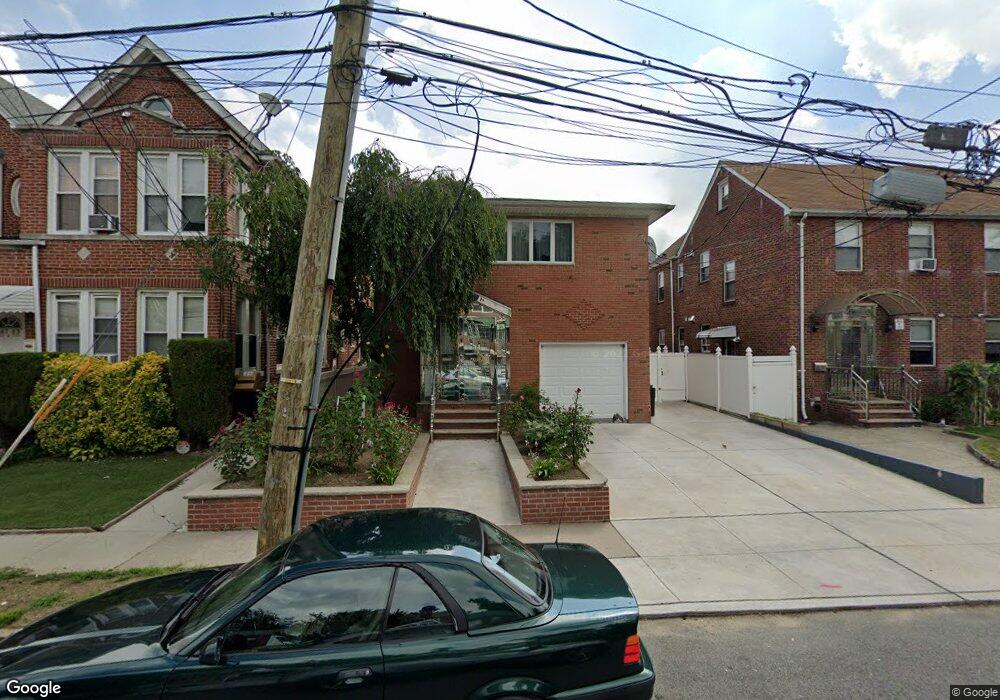
4707 163rd St Flushing, NY 11358
Flushing NeighborhoodEstimated Value: $1,201,000 - $1,370,928
Studio
--
Bath
2,348
Sq Ft
$546/Sq Ft
Est. Value
About This Home
This home is located at 4707 163rd St, Flushing, NY 11358 and is currently estimated at $1,282,732, approximately $546 per square foot. 4707 163rd St is a home located in Queens County with nearby schools including P.S. 107 Thomas A Dooley, Rachel Carson I.S. 237Q, and Francis Lewis High School.
Ownership History
Date
Name
Owned For
Owner Type
Purchase Details
Closed on
Feb 6, 2014
Sold by
Hwang Miin-Fei and Hwang Philip
Bought by
Wang Zhenying and Zhang Shanhe
Current Estimated Value
Home Financials for this Owner
Home Financials are based on the most recent Mortgage that was taken out on this home.
Original Mortgage
$400,000
Outstanding Balance
$304,134
Interest Rate
4.5%
Mortgage Type
New Conventional
Estimated Equity
$978,598
Purchase Details
Closed on
Feb 16, 2000
Sold by
Astc Developers Llc
Bought by
Hwang Miin Fei and Hwang Philip
Purchase Details
Closed on
Sep 24, 1998
Sold by
Karp Walter and Karp Steven
Bought by
Astc Developers Llc
Create a Home Valuation Report for This Property
The Home Valuation Report is an in-depth analysis detailing your home's value as well as a comparison with similar homes in the area
Home Values in the Area
Average Home Value in this Area
Purchase History
| Date | Buyer | Sale Price | Title Company |
|---|---|---|---|
| Wang Zhenying | $775,000 | -- | |
| Hwang Miin Fei | $443,000 | -- | |
| Astc Developers Llc | $145,000 | Chicago Title Insurance Co |
Source: Public Records
Mortgage History
| Date | Status | Borrower | Loan Amount |
|---|---|---|---|
| Open | Wang Zhenying | $400,000 |
Source: Public Records
Tax History
| Year | Tax Paid | Tax Assessment Tax Assessment Total Assessment is a certain percentage of the fair market value that is determined by local assessors to be the total taxable value of land and additions on the property. | Land | Improvement |
|---|---|---|---|---|
| 2025 | $11,367 | $56,592 | $15,609 | $40,983 |
| 2024 | $11,367 | $56,592 | $15,775 | $40,817 |
| 2023 | $11,281 | $56,164 | $16,085 | $40,079 |
| 2022 | $10,578 | $80,580 | $21,960 | $58,620 |
| 2021 | $10,520 | $68,580 | $21,960 | $46,620 |
| 2020 | $9,982 | $65,640 | $21,960 | $43,680 |
| 2019 | $9,865 | $56,220 | $21,960 | $34,260 |
| 2018 | $9,541 | $46,803 | $15,629 | $31,174 |
| 2017 | $9,001 | $44,155 | $17,857 | $26,298 |
| 2016 | $8,327 | $44,155 | $17,857 | $26,298 |
| 2015 | $4,804 | $39,300 | $19,845 | $19,455 |
| 2014 | $4,804 | $39,300 | $21,673 | $17,627 |
Source: Public Records
Map
Nearby Homes
- 47-23 164th St
- 47-04 167th St
- 46-12 161st St Unit 1D
- 46-12 161st St Unit 2C
- 45-74 164th St
- 4920 167th St
- 157-51 Rose Ave
- 157-18 Laburnum Ave
- 45-57 160th St
- 4547 166th St
- 46-05 158th St
- 46-43 157th St
- 163-02 45th Ave
- 4940 169th St
- 16475 Underhill Ave
- 164-75 Underhill Ave
- 148-29 Laburnum Ave
- 4564 170th St
- 45-19 158th St
- 4363 160th St
- 4703 163rd St
- 4711 163rd St
- 47-01 163rd St Unit 1 F
- 4701 163rd St
- 163-12 Pidgeon Meadow Rd
- 16312 Pidgeon Meadow Rd
- 4717 163rd St
- 16316 Pidgeon Meadow Rd
- 4719 163rd St
- 4719 163rd St
- 4704 163rd St
- 16229 Laburnum Ave
- 162-25 Laburnum Ave
- 47-04 163rd St
- 4706 163rd St
- 4708 163rd St
- 4704 163rd St
- 162-19 Laburnum Ave Unit 2
- 162-19 Laburnum Ave Unit 3
- 16225 Laburnum Ave
Your Personal Tour Guide
Ask me questions while you tour the home.