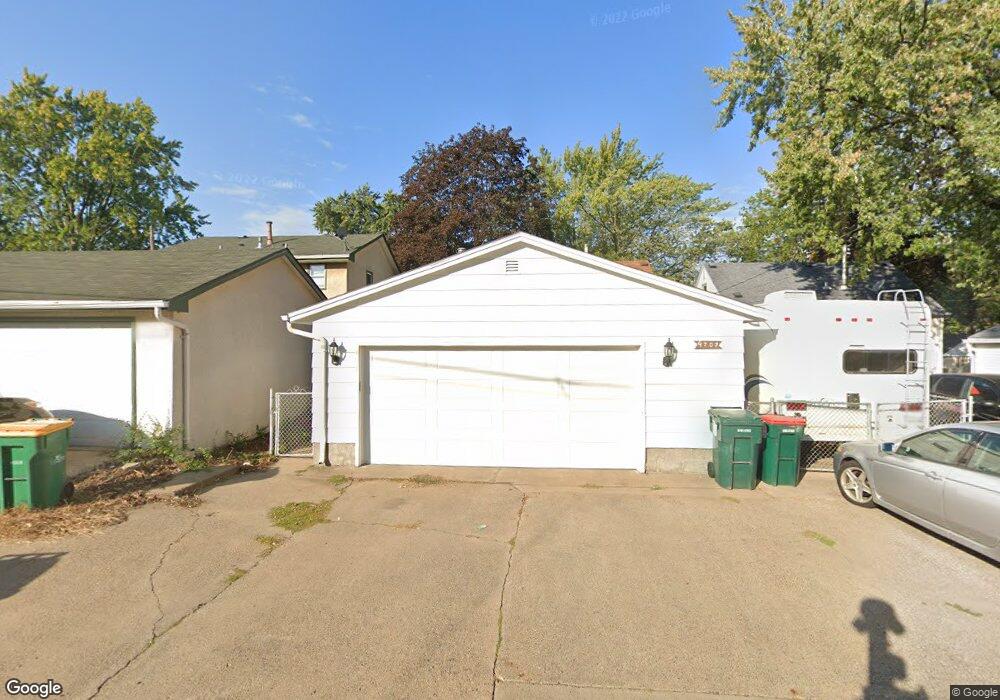
4707 5th St NE Columbia Heights, MN 55421
Estimated Value: $292,000 - $313,000
3
Beds
2
Baths
2,200
Sq Ft
$137/Sq Ft
Est. Value
About This Home
This home is located at 4707 5th St NE, Columbia Heights, MN 55421 and is currently estimated at $301,361, approximately $136 per square foot. 4707 5th St NE is a home located in Anoka County with nearby schools including Valley View Elementary School, Prodeo Academy, and Immaculate Conception Catholic School.
Ownership History
Date
Name
Owned For
Owner Type
Purchase Details
Closed on
Aug 11, 2021
Sold by
Swanson James D
Bought by
Regan Rachel A and Oakley Harrison Tyler
Current Estimated Value
Home Financials for this Owner
Home Financials are based on the most recent Mortgage that was taken out on this home.
Original Mortgage
$261,250
Outstanding Balance
$236,838
Interest Rate
2.7%
Mortgage Type
New Conventional
Estimated Equity
$64,523
Purchase Details
Closed on
Apr 15, 2021
Sold by
Begoridis David K
Bought by
Begordis Martha
Purchase Details
Closed on
Jun 21, 2010
Sold by
Innovest Incorporated
Bought by
Bergordis Martha
Home Financials for this Owner
Home Financials are based on the most recent Mortgage that was taken out on this home.
Original Mortgage
$140,996
Interest Rate
5.25%
Mortgage Type
FHA
Purchase Details
Closed on
Jun 27, 2001
Sold by
Berulson Garold W and Berulson Sandra L
Bought by
Brueggeman William M
Create a Home Valuation Report for This Property
The Home Valuation Report is an in-depth analysis detailing your home's value as well as a comparison with similar homes in the area
Home Values in the Area
Average Home Value in this Area
Purchase History
| Date | Buyer | Sale Price | Title Company |
|---|---|---|---|
| Regan Rachel A | $275,000 | Burnet Title | |
| Begordis Martha | -- | Burnet Title | |
| Bergordis Martha | $130,000 | -- | |
| Brueggeman William M | $149,000 | -- | |
| Regan Rachel Rachel | $275,000 | -- |
Source: Public Records
Mortgage History
| Date | Status | Borrower | Loan Amount |
|---|---|---|---|
| Open | Regan Rachel A | $261,250 | |
| Previous Owner | Bergordis Martha | $140,996 | |
| Closed | Regan Rachel Rachel | $261,250 |
Source: Public Records
Tax History Compared to Growth
Tax History
| Year | Tax Paid | Tax Assessment Tax Assessment Total Assessment is a certain percentage of the fair market value that is determined by local assessors to be the total taxable value of land and additions on the property. | Land | Improvement |
|---|---|---|---|---|
| 2025 | $3,947 | $270,900 | $90,000 | $180,900 |
| 2024 | $3,947 | $268,900 | $90,000 | $178,900 |
| 2023 | $3,238 | $278,700 | $88,500 | $190,200 |
| 2022 | $2,828 | $276,800 | $86,900 | $189,900 |
| 2021 | $2,808 | $220,400 | $66,700 | $153,700 |
| 2020 | $2,651 | $206,200 | $62,000 | $144,200 |
| 2019 | $2,395 | $205,400 | $62,900 | $142,500 |
| 2018 | $2,323 | $183,100 | $0 | $0 |
| 2017 | $1,983 | $170,600 | $0 | $0 |
| 2016 | $2,001 | $142,500 | $0 | $0 |
| 2015 | $1,896 | $142,500 | $48,200 | $94,300 |
| 2014 | -- | $109,700 | $29,200 | $80,500 |
Source: Public Records
Map
Nearby Homes
- 4717 6th St NE
- 4849 5th St NE
- 4559 Washington St NE
- 625 47th Ave NE
- 4507 5th St NE
- 4928 4th St NE
- 4438 6th St NE
- 5006 6th St NE
- 5000 Washington St NE
- 685 49th Ave NE
- 4532 2nd St NE
- 719 49th Ave NE
- 4415 Madison St NE
- 4316 4th St NE
- 4408 2nd St NE
- 4304 Jefferson St NE
- 613 Sullivan Dr NE
- 4228 5th St NE
- 5207 7th St NE
- 1070 Grandview Ct NE Unit 206
- 4711 5th St NE
- 4711 4711 5th-Street-ne
- 4701 5th St NE
- 4715 5th St NE
- 4715 4715 5th-Street-ne
- 4704 6th St NE
- 4700 6th St NE
- 4721 5th St NE
- 4712 6th St NE
- 4659 5th St NE
- 4716 6th St NE
- 4725 5th St NE
- 4708 5th St NE
- 4712 5th St NE
- 4656 6th St NE
- 4702 5th St NE
- 4716 5th St NE
- 4726 6th St NE
- 4655 5th St NE
- 4720 5th St NE