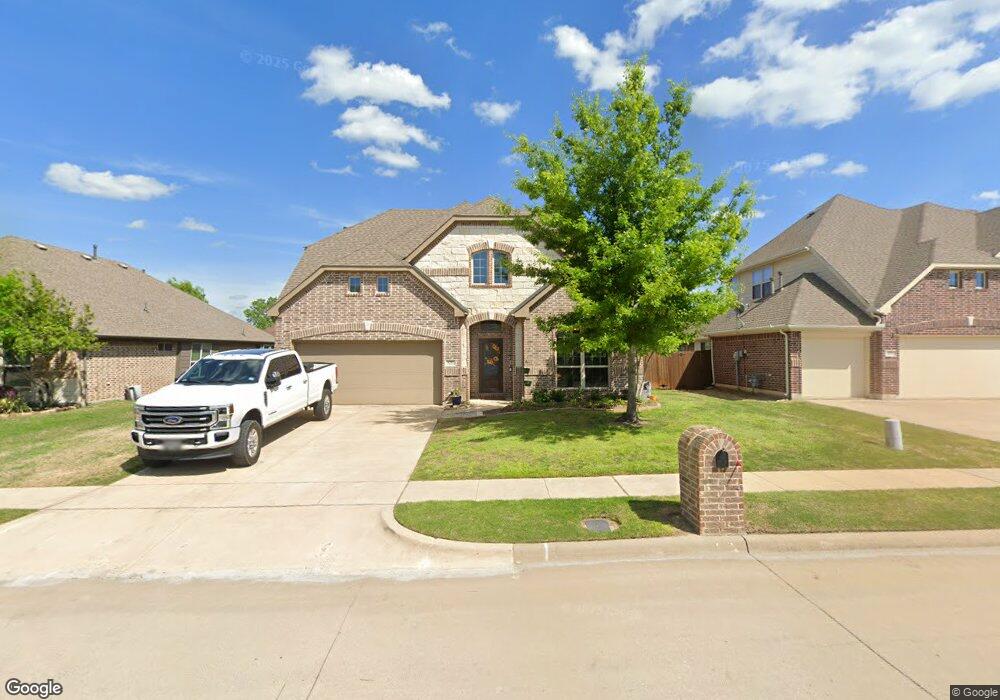
4707 Liberty Hill Trail Sherman, TX 75092
Estimated Value: $364,584 - $399,000
4
Beds
3
Baths
2,412
Sq Ft
$158/Sq Ft
Est. Value
About This Home
This home is located at 4707 Liberty Hill Trail, Sherman, TX 75092 and is currently estimated at $381,792, approximately $158 per square foot. 4707 Liberty Hill Trail is a home located in Grayson County with nearby schools including Percy W. Neblett Elementary School, Dillingham Intermediate School, and Piner Middle School.
Ownership History
Date
Name
Owned For
Owner Type
Purchase Details
Closed on
Nov 18, 2024
Sold by
Dara Sai Prasad and Sayana Sandhya
Bought by
Vinnakota Props Llc
Current Estimated Value
Purchase Details
Closed on
Feb 22, 2019
Sold by
Owens Michael T and Ownes Tera
Bought by
Prasad Dara Sai and Sayana Sandhya
Home Financials for this Owner
Home Financials are based on the most recent Mortgage that was taken out on this home.
Original Mortgage
$205,500
Interest Rate
4.4%
Mortgage Type
New Conventional
Purchase Details
Closed on
Aug 3, 2015
Sold by
Stonehollow Homes Llc
Bought by
Owens Michael T and Owens Tera
Home Financials for this Owner
Home Financials are based on the most recent Mortgage that was taken out on this home.
Original Mortgage
$224,125
Interest Rate
4.06%
Mortgage Type
VA
Create a Home Valuation Report for This Property
The Home Valuation Report is an in-depth analysis detailing your home's value as well as a comparison with similar homes in the area
Home Values in the Area
Average Home Value in this Area
Purchase History
| Date | Buyer | Sale Price | Title Company |
|---|---|---|---|
| Vinnakota Props Llc | -- | None Listed On Document | |
| Prasad Dara Sai | -- | None Available | |
| Owens Michael T | -- | Fatco |
Source: Public Records
Mortgage History
| Date | Status | Borrower | Loan Amount |
|---|---|---|---|
| Previous Owner | Prasad Dara Sai | $205,500 | |
| Previous Owner | Owens Michael T | $224,125 |
Source: Public Records
Tax History Compared to Growth
Tax History
| Year | Tax Paid | Tax Assessment Tax Assessment Total Assessment is a certain percentage of the fair market value that is determined by local assessors to be the total taxable value of land and additions on the property. | Land | Improvement |
|---|---|---|---|---|
| 2025 | $7,862 | $378,644 | $40,500 | $338,144 |
| 2024 | $7,862 | $358,437 | $39,000 | $319,437 |
| 2023 | $9,622 | $410,580 | $39,000 | $371,580 |
| 2022 | $8,082 | $344,857 | $39,000 | $305,857 |
| 2021 | $7,383 | $294,547 | $39,000 | $255,547 |
| 2020 | $7,316 | $278,757 | $35,625 | $243,132 |
| 2019 | $7,137 | $267,242 | $18,750 | $248,492 |
| 2018 | $20 | $240,719 | $18,750 | $221,969 |
| 2017 | $20 | $229,219 | $26,250 | $202,969 |
| 2015 | $0 | $15,251 | $15,251 | $0 |
| 2014 | $19 | $15,251 | $15,251 | $0 |
Source: Public Records
Map
Nearby Homes
- 4703 Liberty Hill Trail
- 4616 Liberty Hill Trail
- 4816 Liberty Hill Trail
- 4701 Camp Verde Cir
- 108 W North Creek Dr
- 4817 Ambergate Ln
- 511 Heritage Ranch Trail
- 413 Heritage Ranch Trail
- 401 Heritage Ranch Trail
- Plan Kahlo at Heritage Ranch - 50ft. lots
- Plan Renoir at Heritage Ranch - 50ft. lots
- Plan Matisse at Heritage Ranch - 50ft. lots
- Plan Dali at Heritage Ranch - 50ft. lots
- Plan Solomon at Heritage Ranch - 50ft. lots
- Plan Bernini at Heritage Ranch - 50ft. lots
- Plan Monet at Heritage Ranch - 50ft. lots
- Plan Botero at Heritage Ranch - 50ft. lots
- Plan Rodin at Heritage Ranch - 50ft. lots
- Plan Picasso at Heritage Ranch - 50ft. lots
- Plan Torres at Heritage Ranch - 50ft. lots
- 4711 Liberty Hill Trail
- 4613 Liberty Hill Trail
- 4706 Liberty Hill Trail
- 4715 Liberty Hill Trail
- 4618 Lone Grove Way
- 4614 Lone Grove Way
- 4702 Liberty Hill Trail
- 4609 Liberty Hill Trail
- 4622 Lone Grove
- 4710 Liberty Hill Trail
- 4610 Lone Grove Way
- 4605 Liberty Hill Trail
- 4714 Liberty Hill Trail
- 4606 Lone Grove Way
- 4612 Liberty Hill Trail
- 4608 Liberty Hill Trail
- 4718 Liberty Hill Trail
- 4615 Lone Grove Way
- 4602 Lone Grove Way
- 4611 Lone Grove Way