Estimated Value: $250,000 - $320,119
2
Beds
2
Baths
1,007
Sq Ft
$285/Sq Ft
Est. Value
About This Home
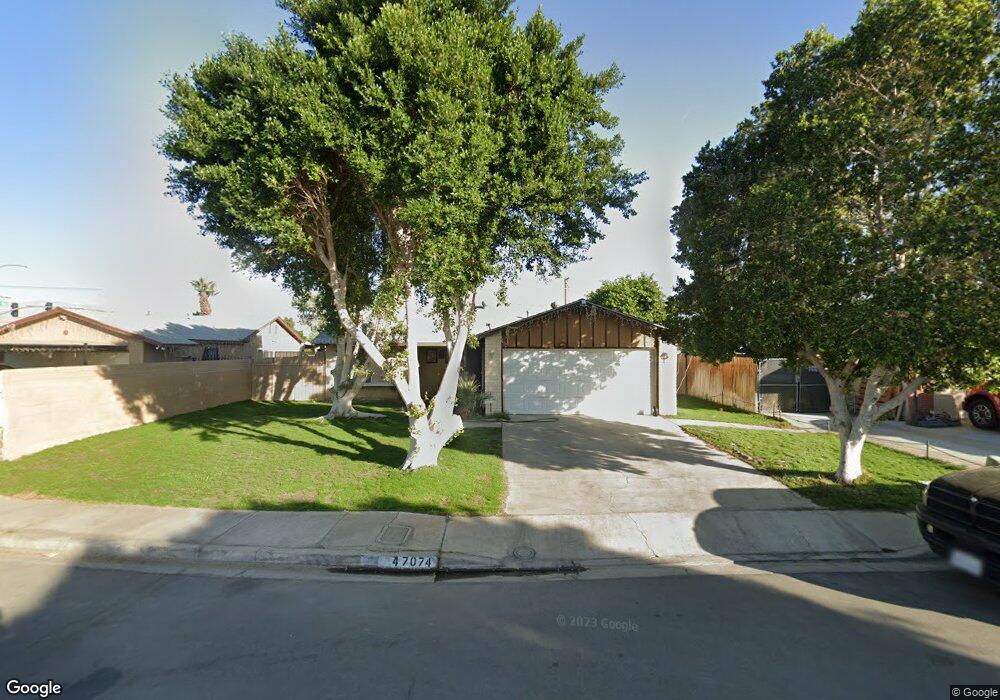
This home is located at 47074 Via Genoa, Indio, CA 92201 and is currently estimated at $287,030, approximately $285 per square foot. 47074 Via Genoa is a home located in Riverside County with nearby schools including Martin Van Buren Elementary School, Thomas Jefferson Middle School, and Indio High School.
Ownership History
Date
Name
Owned For
Owner Type
Purchase Details
Closed on
Mar 6, 2001
Sold by
Sepulveda Jose L and Gutierrez Araceli
Bought by
Soto L Jose and Ramirez Maria L Soto
Current Estimated Value
Home Financials for this Owner
Home Financials are based on the most recent Mortgage that was taken out on this home.
Original Mortgage
$86,837
Interest Rate
6.98%
Mortgage Type
FHA
Purchase Details
Closed on
Apr 14, 1994
Sold by
Cisneros Henry G
Bought by
Sepulveda Jose L and Gutierrez Araceli
Home Financials for this Owner
Home Financials are based on the most recent Mortgage that was taken out on this home.
Original Mortgage
$59,731
Interest Rate
8.1%
Mortgage Type
FHA
Purchase Details
Closed on
Oct 28, 1993
Sold by
Fleet Mtg Corp
Bought by
Hud
Purchase Details
Closed on
Oct 27, 1993
Sold by
Mulligan James P
Bought by
Fleet Mtg Corp
Create a Home Valuation Report for This Property
The Home Valuation Report is an in-depth analysis detailing your home's value as well as a comparison with similar homes in the area
Home Values in the Area
Average Home Value in this Area
Purchase History
| Date | Buyer | Sale Price | Title Company |
|---|---|---|---|
| Soto L Jose | $88,500 | First American Title Co | |
| Sepulveda Jose L | $61,000 | Union Land Title Company | |
| Hud | -- | First Southwestern Title Com | |
| Fleet Mtg Corp | $92,968 | First Southwestern Title Com |
Source: Public Records
Mortgage History
| Date | Status | Borrower | Loan Amount |
|---|---|---|---|
| Previous Owner | Soto L Jose | $86,837 | |
| Previous Owner | Sepulveda Jose L | $59,731 |
Source: Public Records
Tax History Compared to Growth
Tax History
| Year | Tax Paid | Tax Assessment Tax Assessment Total Assessment is a certain percentage of the fair market value that is determined by local assessors to be the total taxable value of land and additions on the property. | Land | Improvement |
|---|---|---|---|---|
| 2025 | $2,845 | $132,871 | $30,120 | $102,751 |
| 2023 | $2,845 | $127,713 | $28,951 | $98,762 |
| 2022 | $2,614 | $125,210 | $28,384 | $96,826 |
| 2021 | $2,426 | $122,756 | $27,828 | $94,928 |
| 2020 | $2,109 | $121,498 | $27,543 | $93,955 |
| 2019 | $2,052 | $119,116 | $27,003 | $92,113 |
| 2018 | $2,000 | $116,781 | $26,475 | $90,306 |
| 2017 | $1,969 | $114,492 | $25,956 | $88,536 |
| 2016 | $1,946 | $112,248 | $25,448 | $86,800 |
| 2015 | $1,899 | $110,565 | $25,067 | $85,498 |
| 2014 | $1,877 | $108,401 | $24,577 | $83,824 |
Source: Public Records
Map
Nearby Homes
- 46440 Doctor Carreon Blvd
- 83734 Doctor Carreon Blvd
- 46581 Denslow St
- 82756 Hartford Ave
- 47666 Margarita St
- 82857 Wheatley Ct
- 47686 Mirage Way
- 82872 Wordsworth Ct
- 47734 Mirage Way
- 82887 Wordsworth Ct
- 82959 Millay Ct
- 82847 Millay Ct
- 12345 Jackson St
- 82431 Priscilla Ct
- 48266 Garbo Dr
- 82815 Davis Dr Unit 67
- 48068 Luna de Nicoleta St
- 82567 Avenue 48 Unit 36
- 47267 Blue Jay St
- 82699 Barrymore St
- 47096 Via Genoa
- 47048 Via Genoa
- 47122 Via Genoa
- 47018 Via Genoa
- 47079 Via Genoa
- 47057 Via Genoa
- 47105 Via Genoa
- 47146 Via Genoa
- 47019 Via Genoa
- 47133 Via Genoa
- 47064 Via Sorrento
- 47084 Via Sorrento
- 47157 Via Genoa
- 47036 Via Sorrento
- 47108 Via Sorrento
- 47132 Via Sorrento
- 82861 Jamestown Ave
- 47196 Via Genoa
- 47183 Via Genoa
- 82849 Jamestown Ave