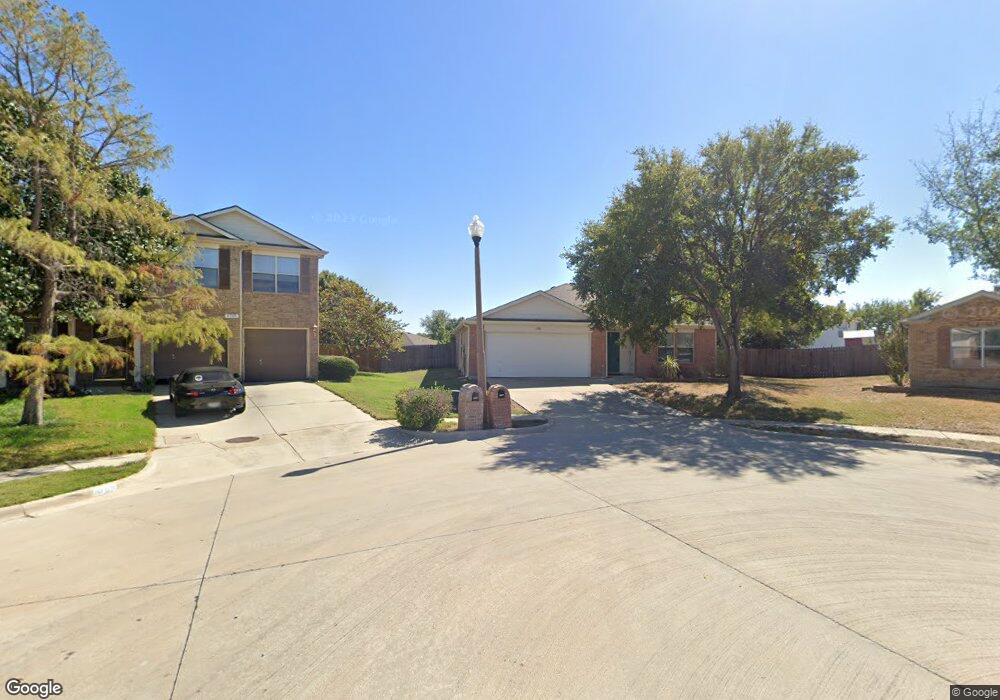
4708 Piedmonte Ct Argyle, TX 76226
Estimated Value: $334,000 - $344,000
3
Beds
2
Baths
1,881
Sq Ft
$179/Sq Ft
Est. Value
About This Home
This home is located at 4708 Piedmonte Ct, Argyle, TX 76226 and is currently estimated at $337,262, approximately $179 per square foot. 4708 Piedmonte Ct is a home located in Denton County with nearby schools including Borman Elementary School, McMath Middle School, and Denton High School.
Ownership History
Date
Name
Owned For
Owner Type
Purchase Details
Closed on
Dec 3, 2019
Sold by
Caron Jean Cecile and Caron Jean C
Bought by
Boren Britni and Boren Kodey
Current Estimated Value
Home Financials for this Owner
Home Financials are based on the most recent Mortgage that was taken out on this home.
Original Mortgage
$210,900
Outstanding Balance
$185,939
Interest Rate
3.6%
Mortgage Type
New Conventional
Estimated Equity
$151,323
Purchase Details
Closed on
Jun 28, 2016
Sold by
Nicole Jane Henze
Bought by
Arsenault Joseph
Home Financials for this Owner
Home Financials are based on the most recent Mortgage that was taken out on this home.
Original Mortgage
$140,000
Interest Rate
3.56%
Purchase Details
Closed on
Jun 17, 2008
Sold by
Wunder Ryan E and Wunder Melody
Bought by
Henze Nicole Jane and Palmeri Virginia Bannon
Create a Home Valuation Report for This Property
The Home Valuation Report is an in-depth analysis detailing your home's value as well as a comparison with similar homes in the area
Purchase History
We collect this data history from publicly available records. To have your information removed, we recommend requesting removal directly through your county’s website.
| Date | Buyer | Sale Price | Title Company |
|---|---|---|---|
| Boren Britni | -- | Itc | |
| Arsenault Joseph | -- | -- | |
| Henze Nicole Jane | -- | Hftc |
Source: Public Records
Mortgage History
We collect this data history from publicly available records. To have your information removed, we recommend requesting removal directly through your county’s website.
| Date | Status | Borrower | Loan Amount |
|---|---|---|---|
| Open | Boren Britni | $210,900 | |
| Previous Owner | Arsenault Joseph | $140,000 | |
| Previous Owner | Arsenault Joseph | -- |
Source: Public Records
Tax History
| Year | Tax Paid | Tax Assessment Tax Assessment Total Assessment is a certain percentage of the fair market value that is determined by local assessors to be the total taxable value of land and additions on the property. | Land | Improvement |
|---|---|---|---|---|
| 2025 | $5,078 | $319,763 | $81,585 | $238,178 |
| 2024 | $6,274 | $325,040 | $0 | $0 |
| 2023 | $4,445 | $295,491 | $81,585 | $249,965 |
| 2022 | $6,207 | $292,393 | $61,189 | $231,204 |
| 2021 | $5,429 | $244,207 | $61,189 | $183,018 |
| 2020 | $5,253 | $229,807 | $61,189 | $168,618 |
| 2019 | $5,340 | $223,804 | $61,189 | $164,103 |
| 2018 | $4,915 | $203,458 | $61,189 | $147,908 |
| 2017 | $4,572 | $184,962 | $61,189 | $124,272 |
| 2016 | $3,189 | $168,147 | $32,058 | $136,696 |
| 2015 | $3,269 | $152,861 | $32,058 | $120,803 |
| 2014 | $3,269 | $141,253 | $28,051 | $113,202 |
| 2013 | -- | $128,660 | $28,051 | $100,609 |
Source: Public Records
Map
Nearby Homes
- 4501 Claret Ct
- 3713 Bonnie Brae St
- 3717 Bonnie Brae St
- 3700 Tarpon Dr
- 3728 Tarpon Dr
- 3736 Tarpon Dr
- 3752 Tarpon Dr
- 3309 Emerald Trace Dr
- 3305 Emerald Trace Dr
- 3301 Emerald Trace Dr
- 4704 Shagbark Dr
- 3300 Emerald Trace Dr
- 3212 Emerald Trace Dr
- 3208 Emerald Trace Dr
- 3205 Emerald Trace Dr
- 3204 Emerald Trace Dr
- 5800 Bull Creek Ln
- 5824 Harvey Gap Ln
- 3816 Canyon Verde Ln
- 4715 Bonnie Brae St
- 4709 Piedmonte Ct
- 4704 Piedmonte Ct
- 4216 Sonoma Dr
- 4212 Sonoma Dr
- 4300 Sonoma Dr
- 4208 Sonoma Dr
- 4700 Piedmonte Ct
- 4705 Piedmonte Ct
- 4304 Sonoma Dr
- 4204 Sonoma Dr
- 4704 Provence Dr
- 4708 Provence Dr
- 4701 Piedmonte Ct
- 4308 Sonoma Dr
- 4700 Provence Dr
- 4205 Vinyard Way
- 4200 Sonoma Dr
- 4219 Sonoma Dr
- 4213 Sonoma Dr
- 4301 Sonoma Dr
Your Personal Tour Guide
Ask me questions while you tour the home.