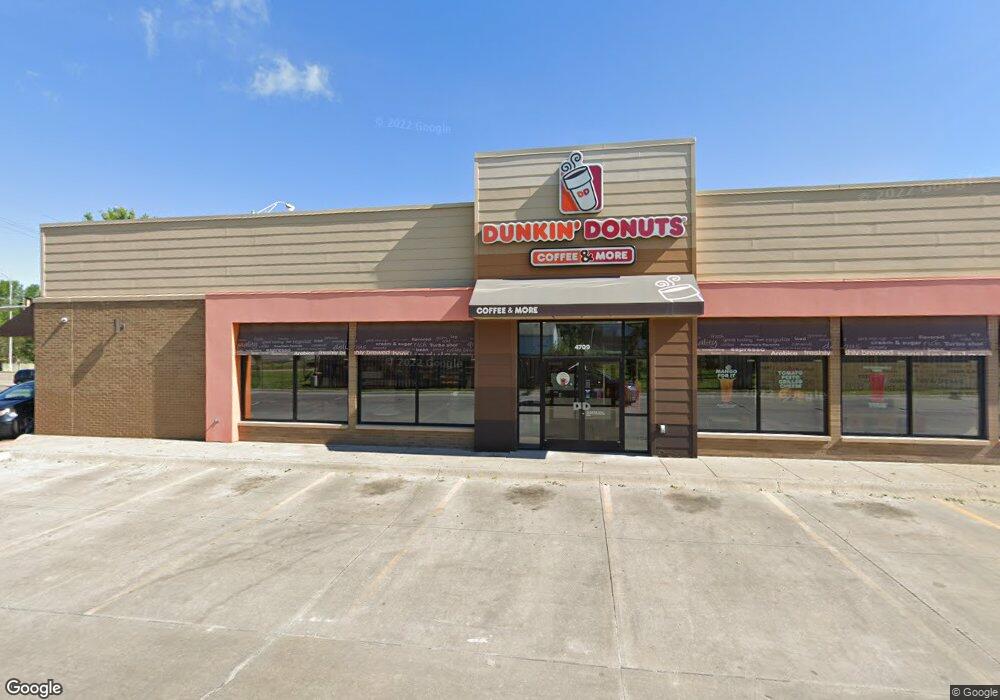
4709 L St Omaha, NE 68117
South Central Omaha Neighborhood
--
Bed
--
Bath
2,360
Sq Ft
0.55
Acres
About This Home
This home is located at 4709 L St, Omaha, NE 68117. 4709 L St is a home located in Douglas County with nearby schools including Ashland Park-Robbins Elementary School, St Thomas More School, and St. Peter Claver Christo Rey High School.
Ownership History
Date
Name
Owned For
Owner Type
Purchase Details
Closed on
May 1, 2025
Sold by
Galaxy Ventures Ii Llc
Bought by
4709 L Street Llc
Home Financials for this Owner
Home Financials are based on the most recent Mortgage that was taken out on this home.
Original Mortgage
$1,650,000
Outstanding Balance
$1,644,180
Interest Rate
6.67%
Mortgage Type
Credit Line Revolving
Purchase Details
Closed on
Nov 25, 2013
Sold by
Joes Repair Service Inc
Bought by
Galaxy Ventures Ii Llc
Create a Home Valuation Report for This Property
The Home Valuation Report is an in-depth analysis detailing your home's value as well as a comparison with similar homes in the area
Home Values in the Area
Average Home Value in this Area
Purchase History
| Date | Buyer | Sale Price | Title Company |
|---|---|---|---|
| 4709 L Street Llc | $870,000 | None Listed On Document | |
| Galaxy Ventures Ii Llc | $580,000 | Missouri River Title |
Source: Public Records
Mortgage History
| Date | Status | Borrower | Loan Amount |
|---|---|---|---|
| Open | 4709 L Street Llc | $1,650,000 |
Source: Public Records
Tax History Compared to Growth
Tax History
| Year | Tax Paid | Tax Assessment Tax Assessment Total Assessment is a certain percentage of the fair market value that is determined by local assessors to be the total taxable value of land and additions on the property. | Land | Improvement |
|---|---|---|---|---|
| 2024 | $13,836 | $655,800 | $147,600 | $508,200 |
| 2023 | $13,836 | $655,800 | $180,500 | $475,300 |
| 2022 | $13,999 | $655,800 | $180,500 | $475,300 |
| 2021 | $13,880 | $655,800 | $180,500 | $475,300 |
| 2020 | $14,040 | $655,800 | $144,400 | $511,400 |
| 2019 | $14,082 | $655,800 | $144,400 | $511,400 |
| 2018 | $14,101 | $655,800 | $144,400 | $511,400 |
| 2017 | $14,170 | $655,800 | $144,400 | $511,400 |
| 2016 | $11,231 | $523,400 | $144,400 | $379,000 |
| 2015 | $4,683 | $474,700 | $144,400 | $330,300 |
| 2014 | $4,683 | $221,200 | $144,400 | $76,800 |
Source: Public Records
Map
Nearby Homes