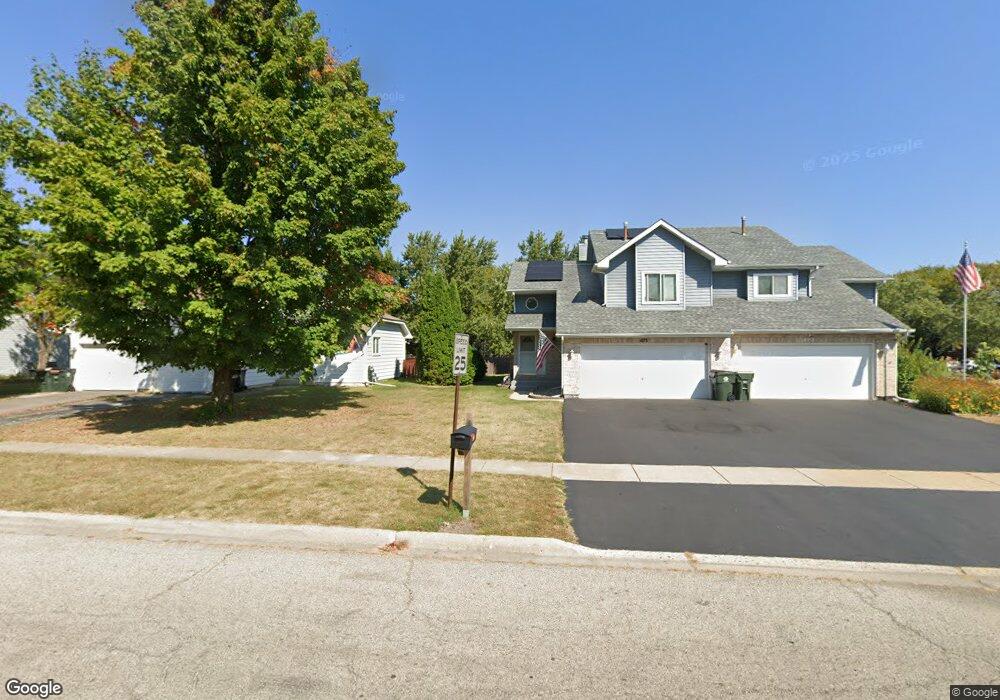
471 Joren Trail Antioch, IL 60002
North Park NeighborhoodEstimated Value: $203,000 - $253,717
2
Beds
2
Baths
1,162
Sq Ft
$194/Sq Ft
Est. Value
About This Home
This home is located at 471 Joren Trail, Antioch, IL 60002 and is currently estimated at $225,429, approximately $194 per square foot. 471 Joren Trail is a home located in Lake County with nearby schools including Antioch Community High School.
Ownership History
Date
Name
Owned For
Owner Type
Purchase Details
Closed on
Dec 1, 2010
Sold by
Marie Lauren Stacy Marie and Marie Lauren Romana
Bought by
Anderson Jeffrey M
Current Estimated Value
Home Financials for this Owner
Home Financials are based on the most recent Mortgage that was taken out on this home.
Original Mortgage
$111,564
Outstanding Balance
$73,483
Interest Rate
4.16%
Mortgage Type
VA
Estimated Equity
$151,946
Purchase Details
Closed on
Feb 1, 2007
Sold by
North Shore Trust & Savings
Bought by
Trawczynski Keith M
Purchase Details
Closed on
Jan 23, 2007
Sold by
Trawczynski Keith Michael
Bought by
Lauren Stacy Marie
Purchase Details
Closed on
Sep 30, 1999
Sold by
Baar Construction Inc
Bought by
Trawczynski Keith M
Home Financials for this Owner
Home Financials are based on the most recent Mortgage that was taken out on this home.
Original Mortgage
$84,800
Interest Rate
7.87%
Create a Home Valuation Report for This Property
The Home Valuation Report is an in-depth analysis detailing your home's value as well as a comparison with similar homes in the area
Home Values in the Area
Average Home Value in this Area
Purchase History
| Date | Buyer | Sale Price | Title Company |
|---|---|---|---|
| Anderson Jeffrey M | $108,000 | Fidelity National Title | |
| Trawczynski Keith M | -- | None Available | |
| Lauren Stacy Marie | -- | None Available | |
| Trawczynski Keith M | $106,000 | -- |
Source: Public Records
Mortgage History
| Date | Status | Borrower | Loan Amount |
|---|---|---|---|
| Open | Anderson Jeffrey M | $111,564 | |
| Previous Owner | Trawczynski Keith M | $84,800 |
Source: Public Records
Tax History Compared to Growth
Tax History
| Year | Tax Paid | Tax Assessment Tax Assessment Total Assessment is a certain percentage of the fair market value that is determined by local assessors to be the total taxable value of land and additions on the property. | Land | Improvement |
|---|---|---|---|---|
| 2024 | $4,712 | $56,744 | $3,956 | $52,788 |
| 2023 | $4,376 | $50,809 | $3,542 | $47,267 |
| 2022 | $4,376 | $44,963 | $4,226 | $40,737 |
| 2021 | $4,033 | $41,955 | $3,943 | $38,012 |
| 2020 | $3,940 | $40,796 | $3,834 | $36,962 |
| 2019 | $3,983 | $39,013 | $3,666 | $35,347 |
| 2018 | $3,724 | $35,422 | $3,723 | $31,699 |
| 2017 | $3,937 | $37,868 | $3,544 | $34,324 |
| 2016 | $3,825 | $36,545 | $3,420 | $33,125 |
| 2015 | $3,724 | $35,615 | $3,333 | $32,282 |
| 2014 | $3,211 | $33,658 | $7,200 | $26,458 |
| 2012 | $3,928 | $39,708 | $7,200 | $32,508 |
Source: Public Records
Map
Nearby Homes
- 425 Joren Trail
- 570 Collier Dr
- 603 Ridgewood Dr
- 558 1st St
- 582 Phillips Cir
- 336 Hawthorn Ln
- 394 Birchwood Dr
- 602 Anita Ave
- 801 Main St
- 12719 234th Ave
- 735 Creek Bend Ln
- 23607 125th St
- 770 Anita Ave
- 811 Tiffany Farms Rd
- 188 Oakwood Dr
- 324 Elmwood Ln
- 198 Bridgewood Dr
- 672 Garys Dr
- 900 Elizabeth St
- 73 W Old Mill Trail
- 473 Joren Trail
- 469 Joren Trail
- 467 Joren Trail
- 465 Joren Trail
- 463 Joren Trail
- 472 Joren Trail
- 474 Joren Trail
- 476 Joren Trail
- 470 Joren Trail
- 478 Joren Trail
- 480 Joren Trail
- 466 Joren Trail
- 457 Joren Trail
- 437 Johelia Trail
- 435 Johelia Trail
- 464 Joren Trail
- 482 Donin Dr
- 482 Donin Dr Unit 1
- 431 Johelia Trail
- 467 Johelia Trail