Estimated Value: $125,000 - $174,000
--
Bed
--
Bath
1,040
Sq Ft
$145/Sq Ft
Est. Value
About This Home
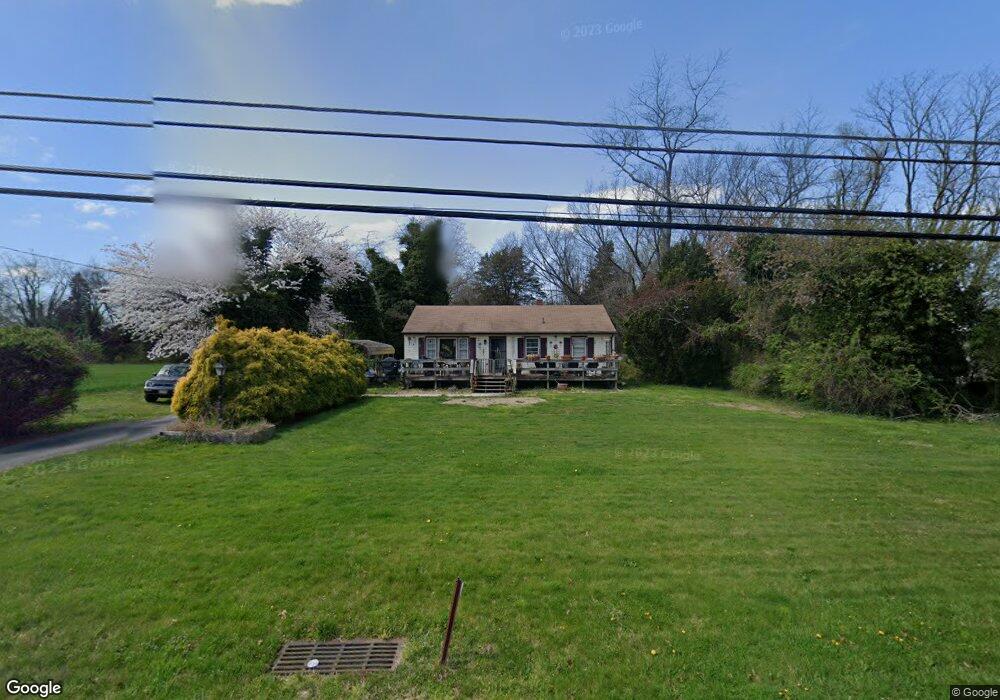
This home is located at 471 Kent St, Salem, NJ 08079 and is currently estimated at $150,697, approximately $144 per square foot. 471 Kent St is a home located in Salem County with nearby schools including John Fenwick Elementary School, Salem Middle School, and Salem High School.
Ownership History
Date
Name
Owned For
Owner Type
Purchase Details
Closed on
Dec 28, 2000
Sold by
Love Sarah D
Bought by
Love Sarah D
Current Estimated Value
Purchase Details
Closed on
Dec 23, 1998
Sold by
Berry Audrey J and Brown Audrey J
Bought by
Berry George R and Berry Audrey J
Home Financials for this Owner
Home Financials are based on the most recent Mortgage that was taken out on this home.
Original Mortgage
$66,400
Interest Rate
6.84%
Create a Home Valuation Report for This Property
The Home Valuation Report is an in-depth analysis detailing your home's value as well as a comparison with similar homes in the area
Home Values in the Area
Average Home Value in this Area
Purchase History
| Date | Buyer | Sale Price | Title Company |
|---|---|---|---|
| Love Sarah D | -- | -- | |
| Berry George R | -- | Salem Oak Title Agency Inc |
Source: Public Records
Mortgage History
| Date | Status | Borrower | Loan Amount |
|---|---|---|---|
| Closed | Berry George R | $66,400 |
Source: Public Records
Tax History Compared to Growth
Tax History
| Year | Tax Paid | Tax Assessment Tax Assessment Total Assessment is a certain percentage of the fair market value that is determined by local assessors to be the total taxable value of land and additions on the property. | Land | Improvement |
|---|---|---|---|---|
| 2025 | $5,015 | $61,000 | $15,400 | $45,600 |
| 2024 | $4,795 | $61,000 | $15,400 | $45,600 |
| 2023 | $4,795 | $61,000 | $15,400 | $45,600 |
| 2022 | $4,585 | $61,000 | $15,400 | $45,600 |
| 2021 | $4,426 | $61,000 | $15,400 | $45,600 |
| 2020 | $4,338 | $61,000 | $15,400 | $45,600 |
| 2019 | $4,312 | $61,000 | $15,400 | $45,600 |
| 2018 | $4,218 | $61,000 | $15,400 | $45,600 |
| 2017 | $4,166 | $61,000 | $15,400 | $45,600 |
| 2016 | $4,527 | $115,600 | $46,100 | $69,500 |
| 2015 | $4,469 | $115,600 | $46,100 | $69,500 |
| 2014 | $4,446 | $115,600 | $46,100 | $69,500 |
Source: Public Records
Map
Nearby Homes
- 453 Afton Dr
- 445 Afton Dr
- 441-443 Afton Dr
- 437-439 Afton Dr Afton Dr
- 433-435 Afton Dr
- 14 Hillcrest Terrace
- 61-63 Yorke St
- 39 Yorke St
- 410 Magnolia St
- 14 Yorke St
- 27 Davis Ave
- 171 Yorke St
- 10 Davis Ave
- 385 387 E Broadway
- 2 New Bridge Rd Unit C-3
- 369 E Broadway
- 330 332 E Broadway
- 5 Olive St
- 200 N Union St
- 217 Smith St