
Seller's Agent in 2025
Matthew Schorr
Compass
(775) 901-1465
1 in this area
42 Total Sales
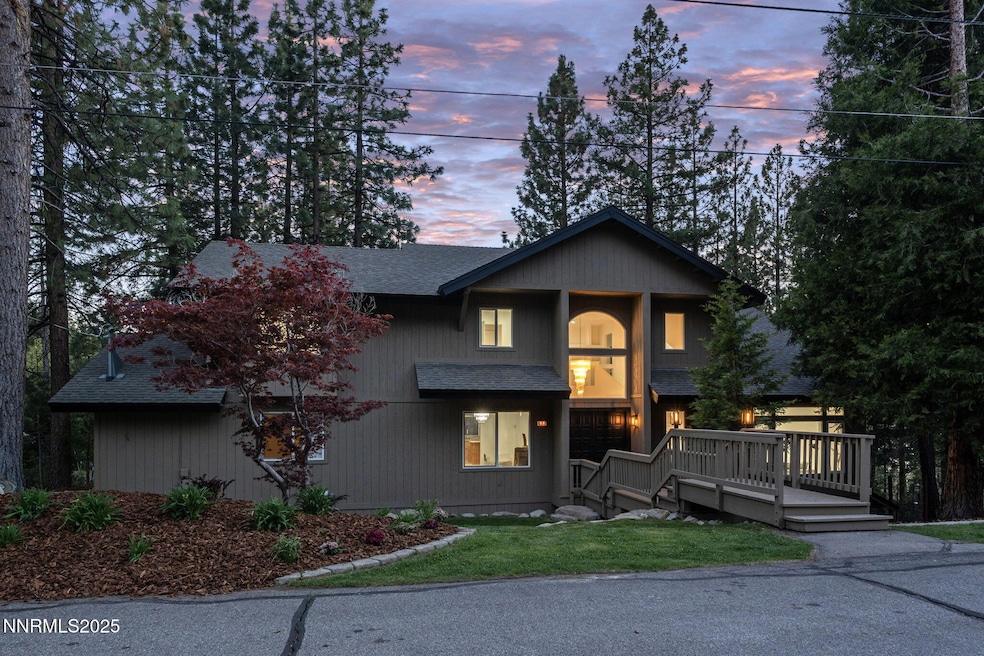
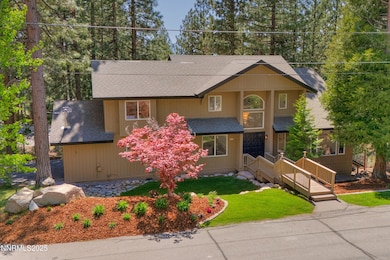
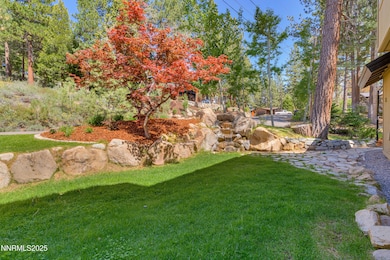
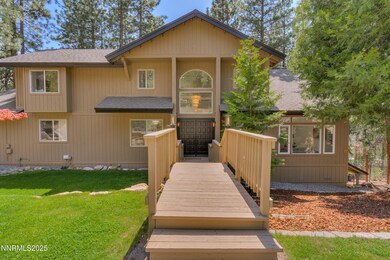
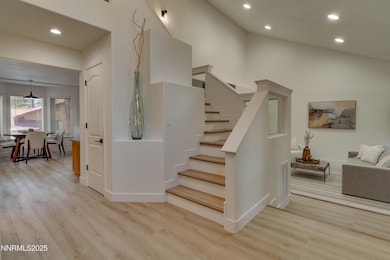
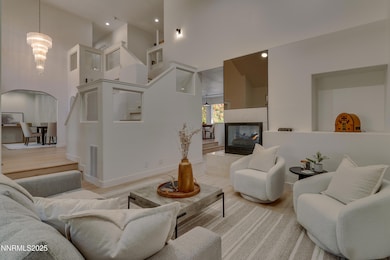
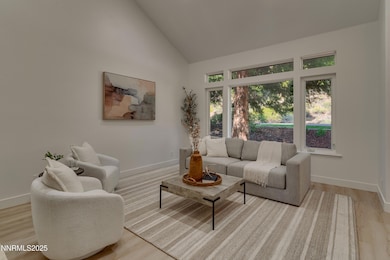
Discover this recently remodeled Tahoe gem, showcasing a refreshed mountain modern look that perfectly blends style and comfort. Nestled on the Nevada side in a quiet cul-de-sac, this stunning home offers the ideal mix of adventure, relaxation, and community. Just a 5-minute walk to Lake Tahoe's stunning beaches, this prime location provides direct access to Zephyr Cove/Stateline/South Lake Tahoe bike trails, as well as hiking and mountain biking paths connecting to the Rim Trail or scenic local loops. Outdoor enthusiasts will thrive here, with level streets ideal for walking or biking. Convenience meets tranquility—grocery stores, shops, restaurants, and vibrant casinos are all within strolling distance, yet the home remains a peaceful haven with wonderful neighbors. Across the street, a natural area owned by Nevada State Lands enhances the sense of seclusion, while the private front yard offers a serene escape. The low-maintenance property boasts a timeless design, with a south-facing driveway that naturally melts snow, minimizing winter upkeep. The front yard, featuring a beautiful waterfall and simple landscaping, is perfect for unwinding. Inside, enjoy a fresh, modern interior with new paint, sleek new flooring, and beautiful new bathrooms that elevate the home's appeal. Vaulted ceilings create an open, airy feel, complemented by spacious bedrooms with ample storage. The home stays cool in summer and is located in a neighborhood with less snow than most in Tahoe, ensuring year-round comfort. Embrace the Tahoe lifestyle with this rare gem—where adventure, convenience, and tranquility converge. Don't miss your chance to call this special place home!
| Date | Type | Sale Price | Title Company |
|---|---|---|---|
| Bargain Sale Deed | $1,500,000 | Signature Title Services | |
| Interfamily Deed Transfer | -- | None Available | |
| Interfamily Deed Transfer | -- | First Americantitle Statel | |
| Bargain Sale Deed | $415,000 | First American Title Statel |
| Date | Status | Loan Amount | Loan Type |
|---|---|---|---|
| Open | $806,000 | New Conventional | |
| Previous Owner | $385,000 | New Conventional |
| Date | Event | Price | List to Sale | Price per Sq Ft | Prior Sale |
|---|---|---|---|---|---|
| 06/25/2025 06/25/25 | Sold | $1,500,000 | +0.1% | $592 / Sq Ft | |
| 06/02/2025 06/02/25 | For Sale | $1,499,000 | +261.2% | $591 / Sq Ft | |
| 06/07/2012 06/07/12 | Sold | $415,000 | -30.3% | $164 / Sq Ft | View Prior Sale |
| 02/16/2012 02/16/12 | Pending | -- | -- | -- | |
| 12/19/2011 12/19/11 | For Sale | $595,000 | -- | $235 / Sq Ft |
| Year | Tax Paid | Tax Assessment Tax Assessment Total Assessment is a certain percentage of the fair market value that is determined by local assessors to be the total taxable value of land and additions on the property. | Land | Improvement |
|---|---|---|---|---|
| 2025 | $3,917 | $211,702 | $105,000 | $106,702 |
| 2024 | $3,917 | $212,846 | $105,000 | $107,846 |
| 2023 | $3,843 | $204,889 | $105,000 | $99,889 |
| 2022 | $3,686 | $186,068 | $92,750 | $93,318 |
| 2021 | $3,575 | $173,129 | $84,000 | $89,129 |
| 2020 | $3,471 | $171,491 | $84,000 | $87,491 |
| 2019 | $3,371 | $170,119 | $84,000 | $86,119 |
| 2018 | $3,273 | $164,340 | $80,500 | $83,840 |
| 2017 | $3,176 | $154,236 | $70,000 | $84,236 |
| 2016 | $3,098 | $154,855 | $70,000 | $84,855 |
| 2015 | $3,091 | $154,855 | $70,000 | $84,855 |
| 2014 | $3,326 | $149,250 | $70,000 | $79,250 |
Seller's Agent in 2025
Matthew Schorr
Compass
(775) 901-1465
1 in this area
42 Total Sales
Buyer's Agent in 2025
Penny Johnson
Blue Sierra Realty
(775) 770-0029
1 in this area
56 Total Sales
J
Seller's Agent in 2012
John Peel
Chase International - ZC
Buyer's Agent in 2012
Carolyn Goff
Coldwell Banker Select ZC
(775) 588-3700
4 in this area
69 Total Sales
Source: Northern Nevada Regional MLS
MLS Number: 250050783
APN: 1318-15-311-021
Disclaimer: Certain information contained herein is derived from information provided by parties other than Homes.com. All information provided is deemed reliable, but is not guaranteed to be accurate and should be independently verified.
![]() IDX information is provided exclusively for personal, non-commercial use, and may not be used for any purpose other than to identify prospective properties consumers may be interested in purchasing. Information is deemed reliable but not guaranteed. The content relating to real estate for sale on this web site comes in part from the Broker Reciprocity/ IDX program of the Northern Nevada Regional Multiple Listing Service°. Real estate listings held by brokerage firms other than Ten-X are marked with the Broker Reciprocity logo and detailed information about those listings includes the name of the listing brokerage. Any use of the content other than by a search performed by a consumer looking to purchase or rent real estate is prohibited. © 2025 Northern Nevada Regional Multiple Listing Service® MLS. All rights reserved.
IDX information is provided exclusively for personal, non-commercial use, and may not be used for any purpose other than to identify prospective properties consumers may be interested in purchasing. Information is deemed reliable but not guaranteed. The content relating to real estate for sale on this web site comes in part from the Broker Reciprocity/ IDX program of the Northern Nevada Regional Multiple Listing Service°. Real estate listings held by brokerage firms other than Ten-X are marked with the Broker Reciprocity logo and detailed information about those listings includes the name of the listing brokerage. Any use of the content other than by a search performed by a consumer looking to purchase or rent real estate is prohibited. © 2025 Northern Nevada Regional Multiple Listing Service® MLS. All rights reserved.